Autochartist
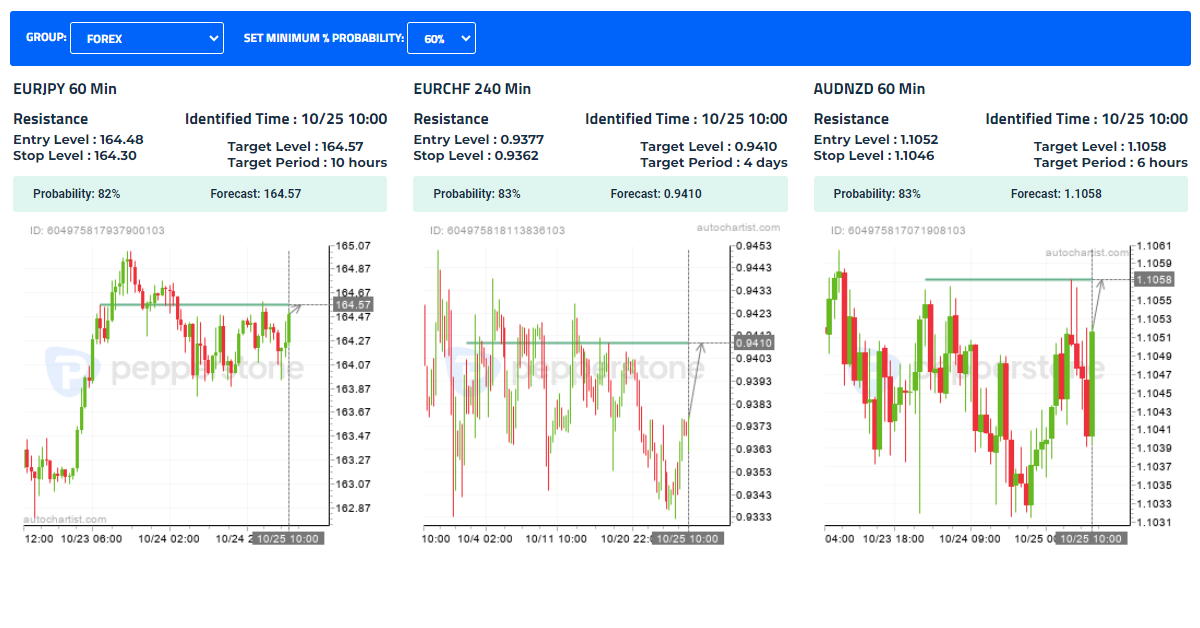
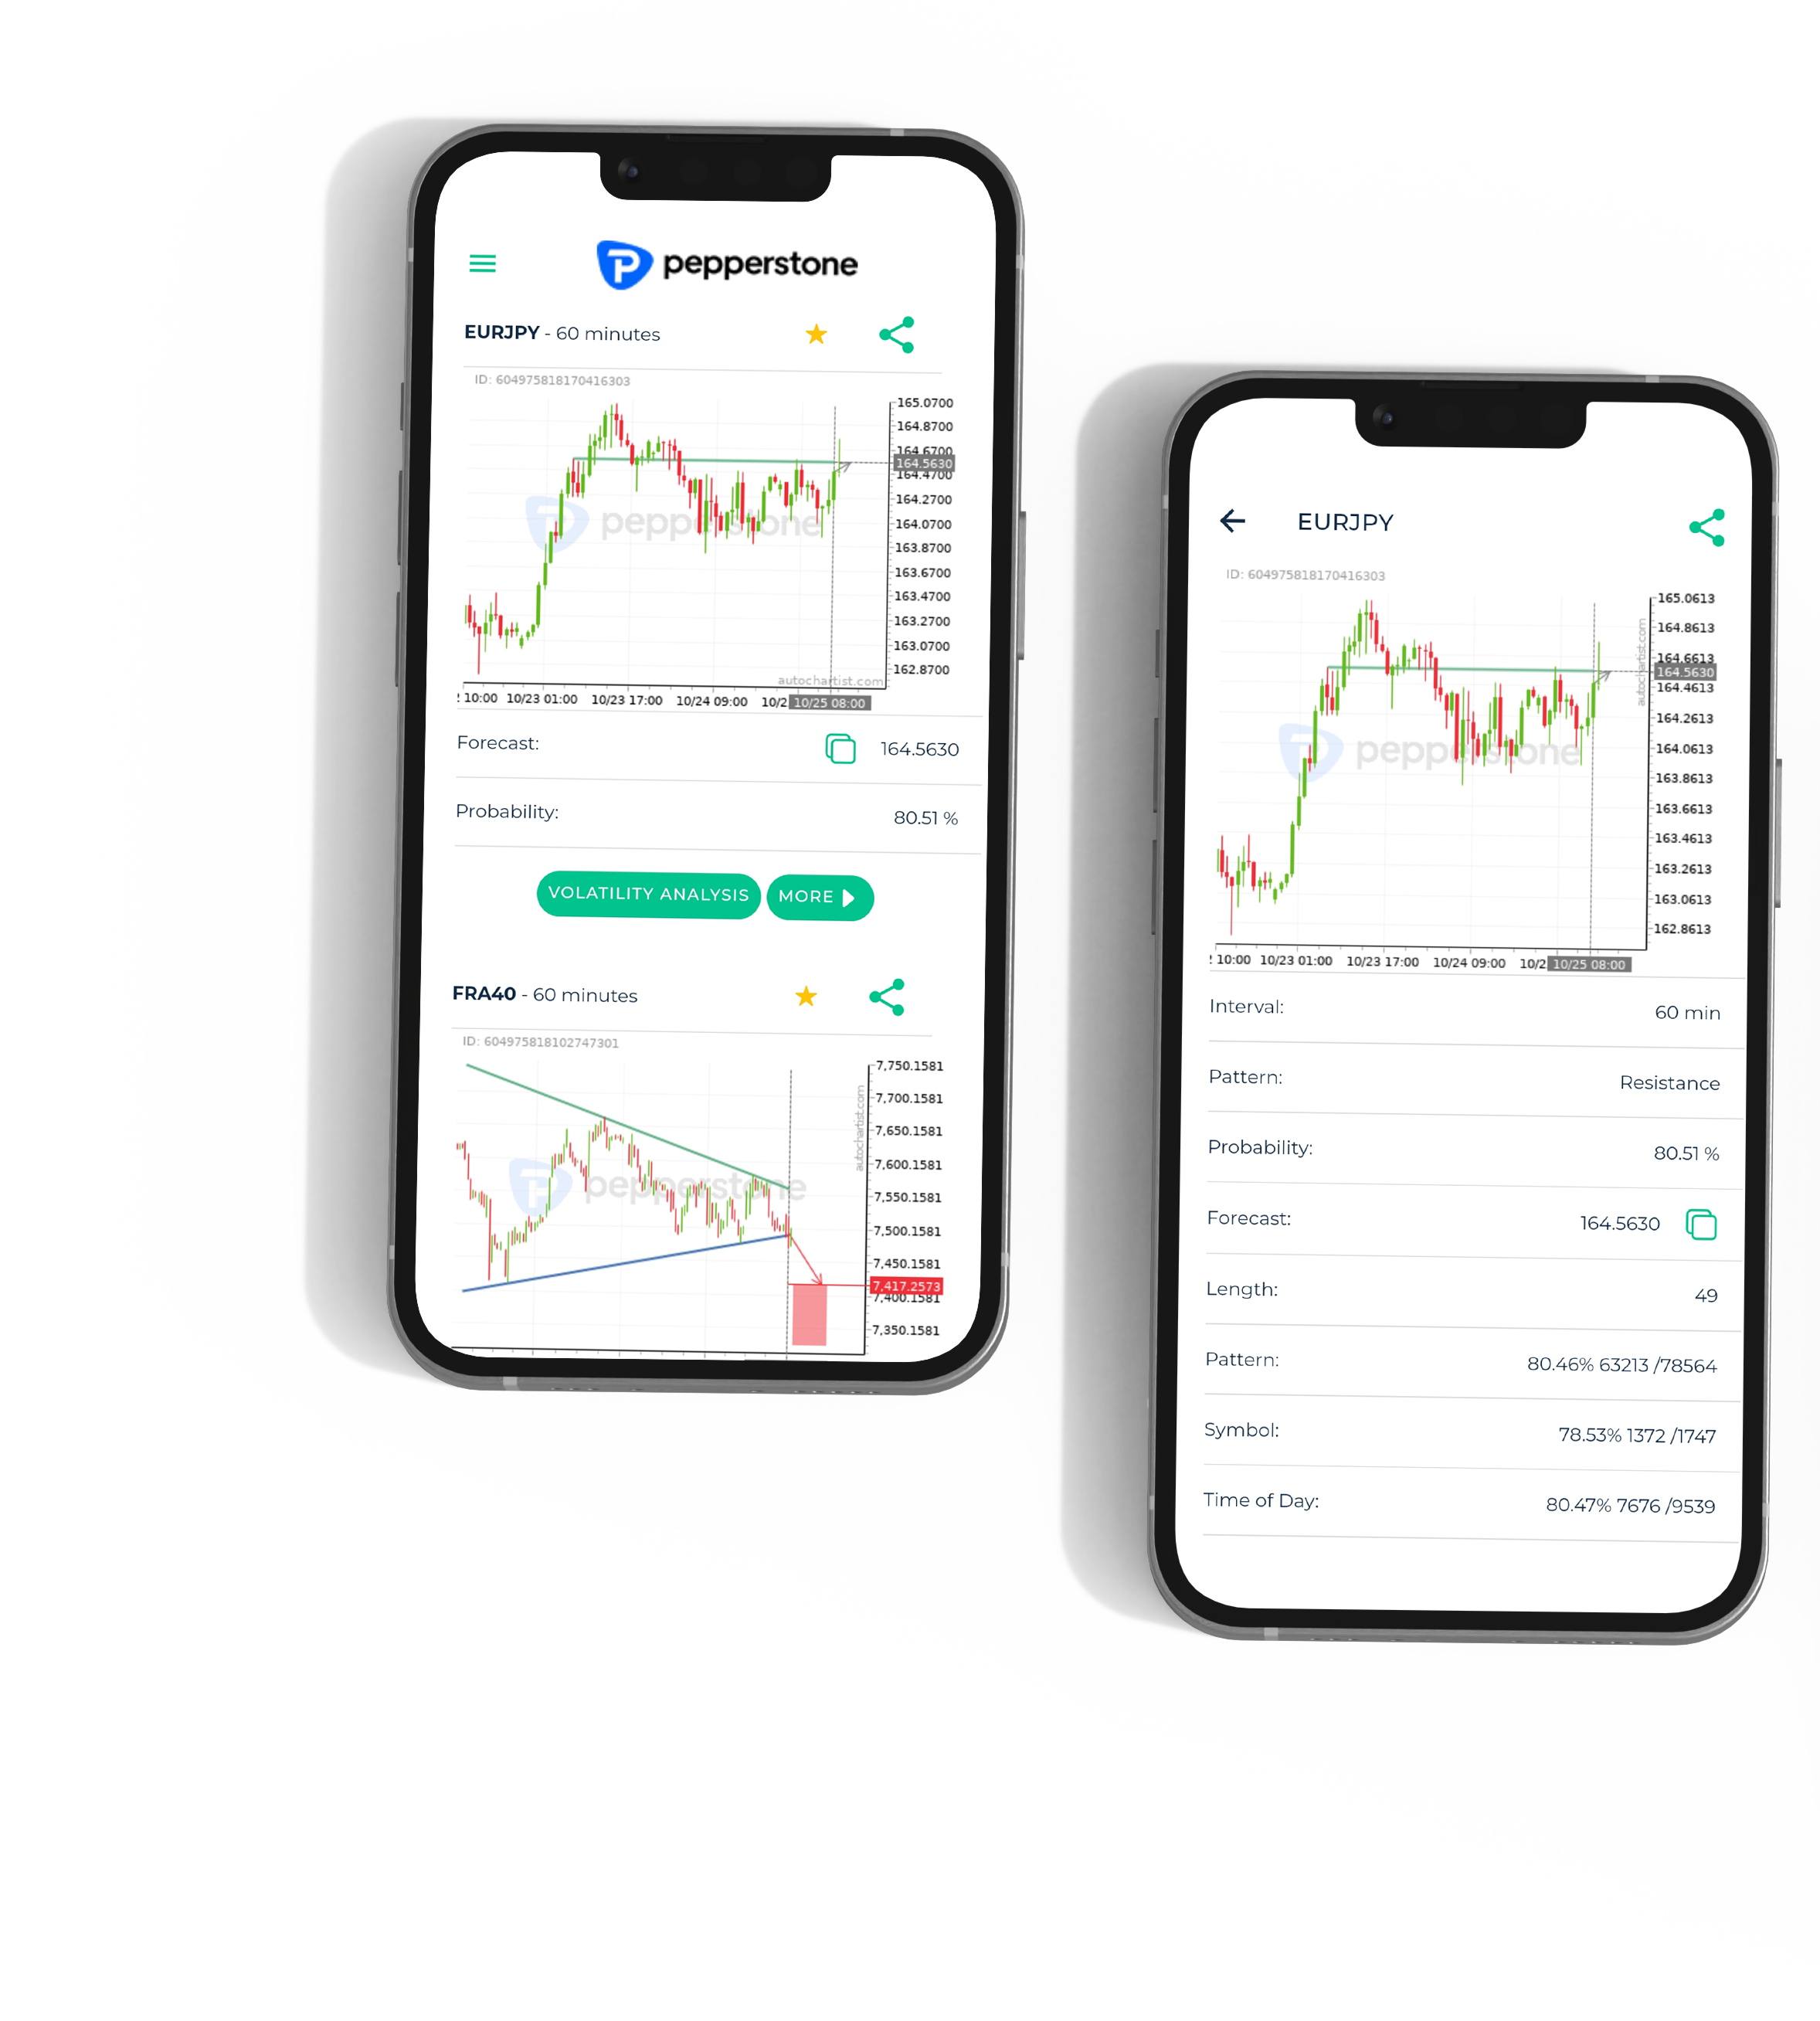
Autochartist Technical analysis can quickly and effectively give you access to 1000’s of real-time opportunities. The tool provides you with built-in filtering functionality to personalise your experience. It saves you time and highlights different trading options to keep you informed on market movements.
Analysis types
Chart Patterns
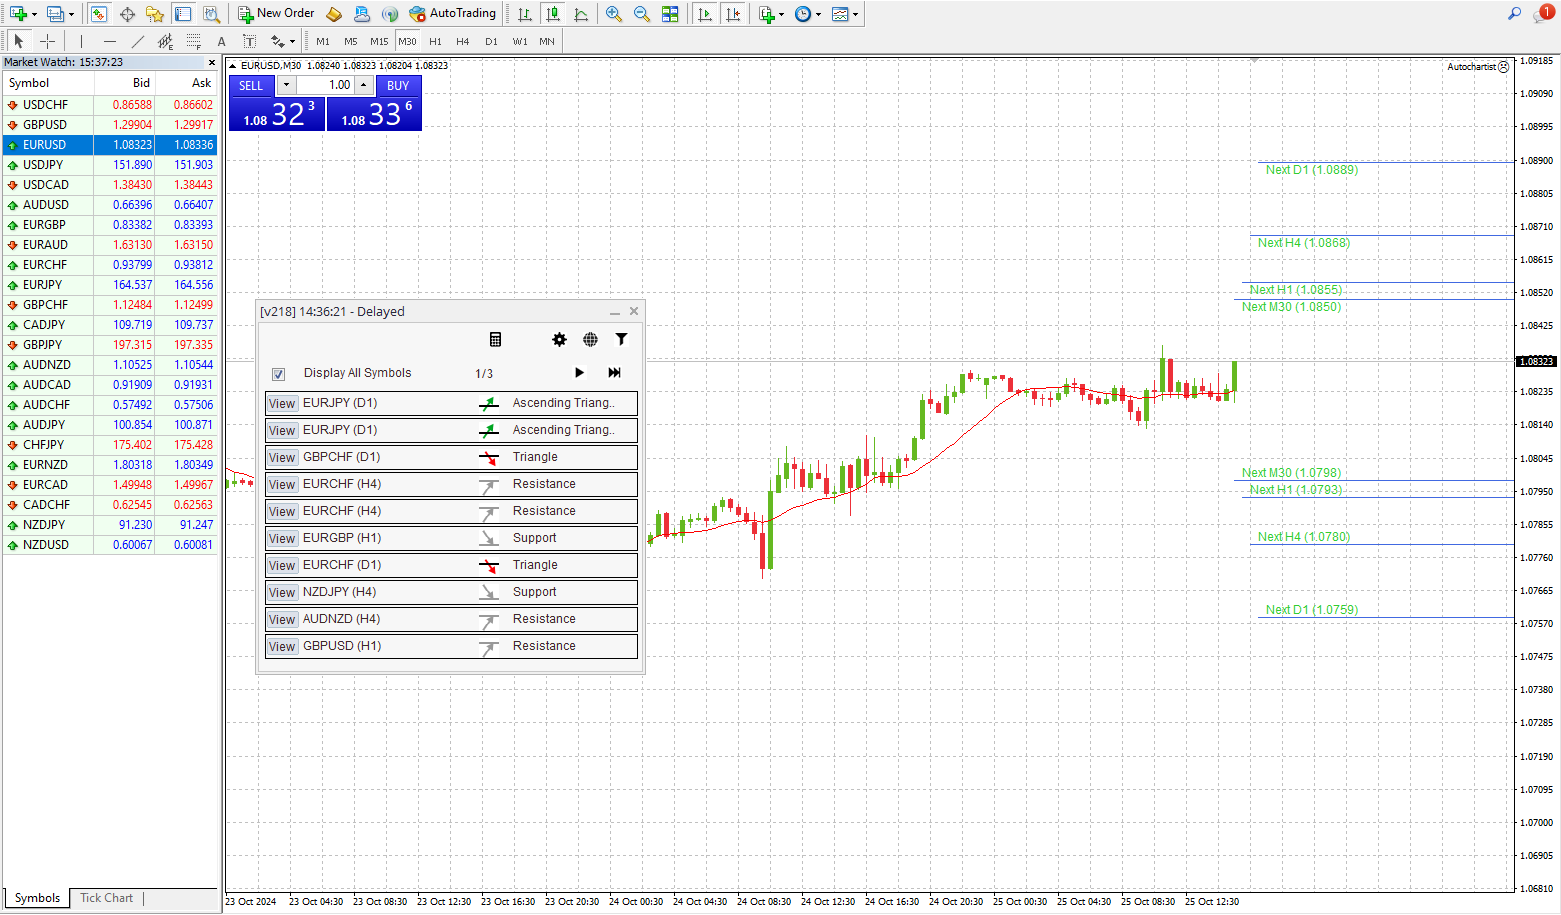
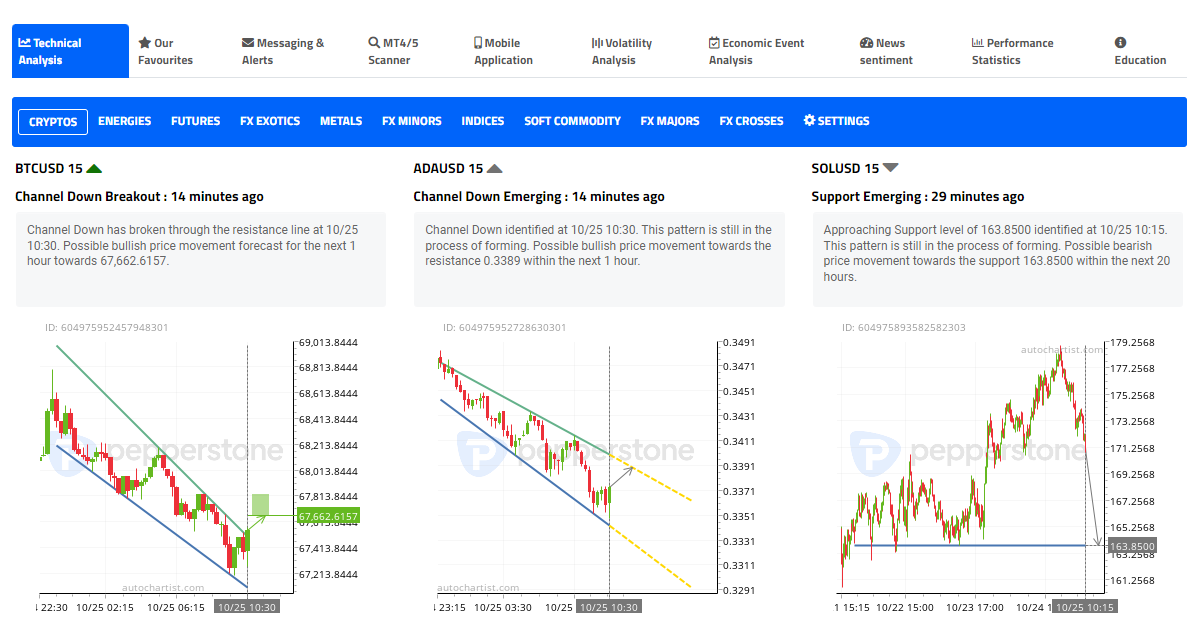
Chart pattern formations that are identified by Autochartist include wedges, triangles, channels, rounding tops and bottoms, and many other patterns. Autochartist also indicates when the price action will reach a predicted target area.
Key Levels
Autochartist Key Levels identify support or resistance levels at significant price levels. This is the most popular analysis type as it is loved by all types of traders. It is simple to understand and great for traders irrespective of their experience level.
Statistical Patterns
Everyone wants to know where the exceptionally large movements in the markets are, as the question is always “What is going to happen next?”. The Autochartist Big Movements and Consecutive Candle Statistical Patterns automatically identify large movements in the market.
Fibonacci Patterns
Autochartist automatically identifies Fibonacci Patterns that can visually illustrate certain levels at which either support or resistance is anticipated, according to the Golden Ratio theory. Levels like that can play an instrumental role in setting up stop-loss levels and identifying trading objectives.
Email Reports
Autochartist in cTrader
Autochartist within the cTrader platform allows traders to simply be presented with available Autochartist trading opportunities. cTrader zones in on what matters most to you: comprehensive content on your favourite instruments.
