- English
- 中文版
The S&P500 & The Golden Cross: Why It Offers No Edge for Short-Term CFD Traders

In my view, the answer is no.
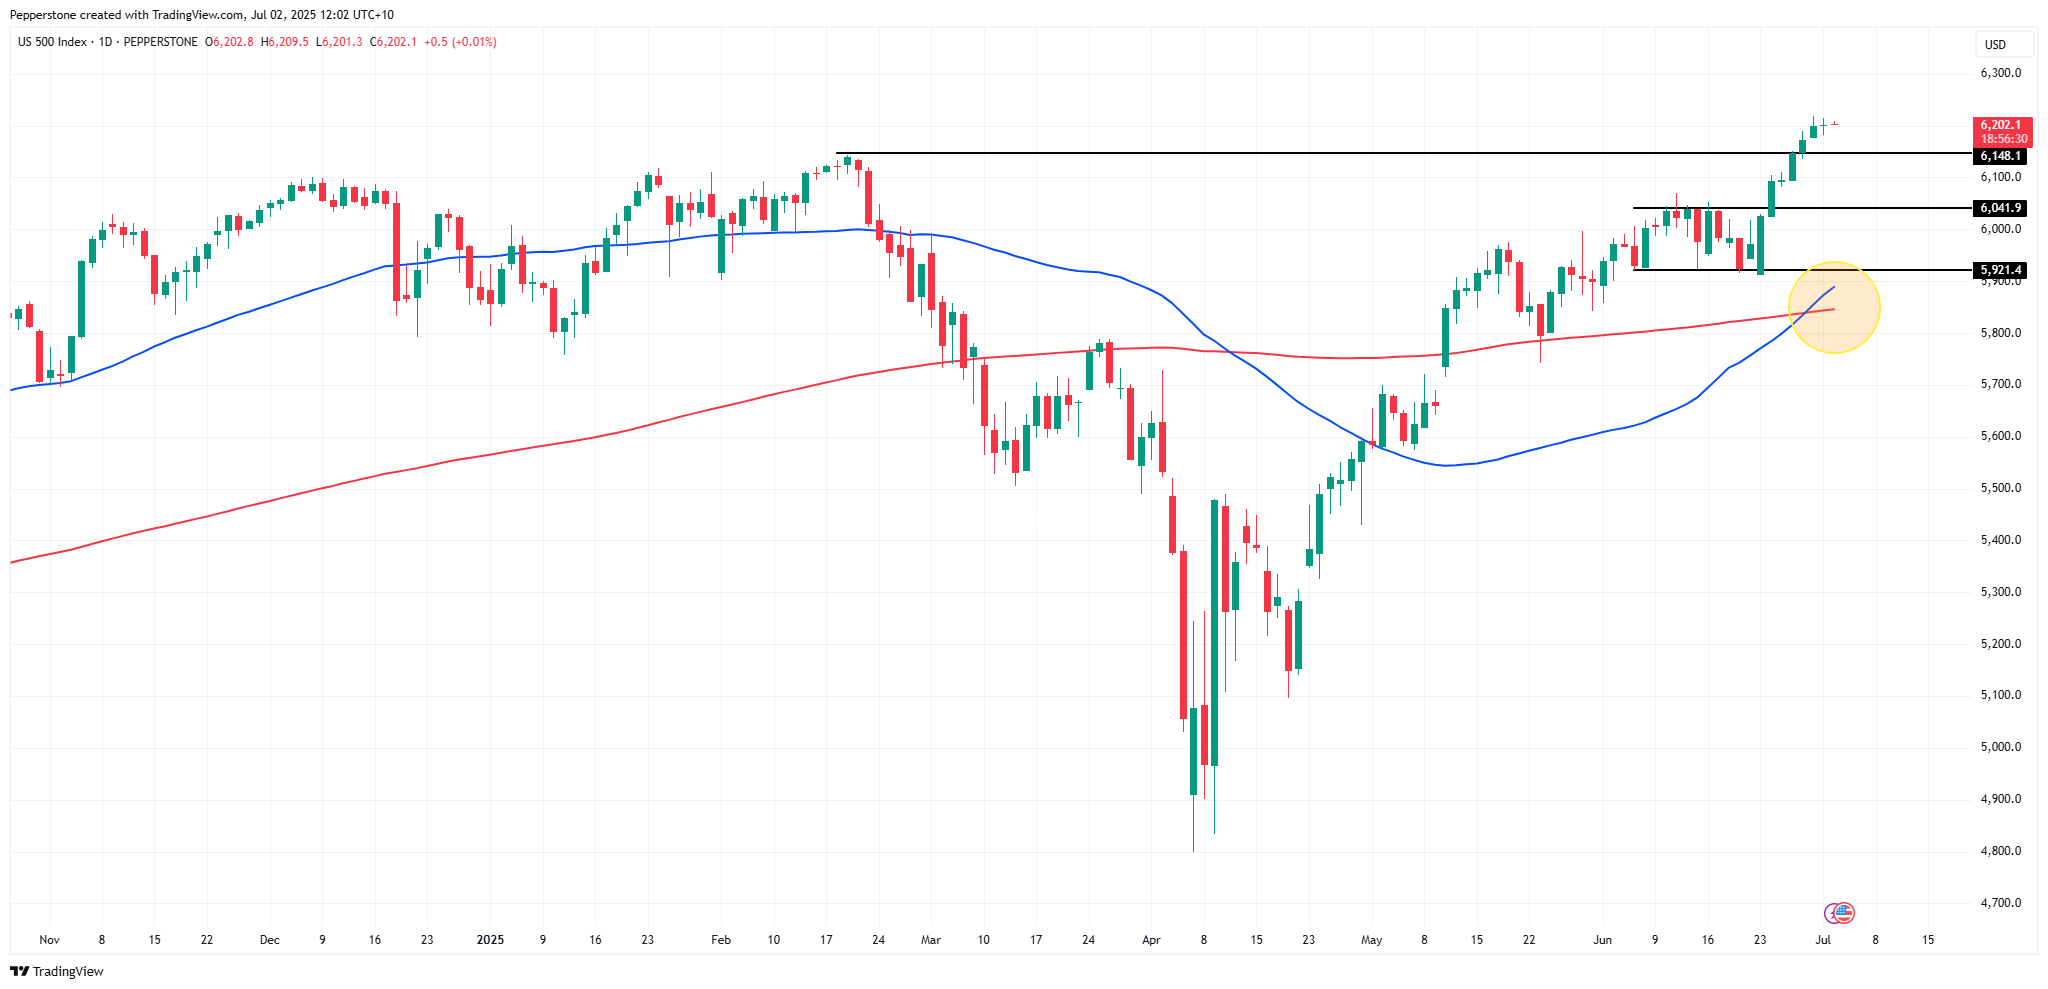
By its nature, the golden cross signals that underlying index momentum is strong – something already evident in the price action. The S&P 500 has rallied an impressive 28% from the April lows, trading at new all-time highs. That alone tells us what we need to know: momentum is intact.
For those deploying momentum or trend-following strategies, a shorter-term MA crossover system is arguably a better tool – either as a component in trade entry or more effectively, as a systematic exit trigger.
One example: I use the 3- & 8-day EMA crossover as a clean exit strategy on higher timeframes. It helps reduce emotional decision-making, allowing me to stay in trending trades longer without the temptation to “buy the dip” and reload at wider spreads. Staying in the trend is the goal – simple systems like this help achieve it.
These basic signals may seem overly simplistic to some. Yet over time, many traders find themselves stripping back complex exit models to simpler rules: a moving average crossover, a trailing ATR stop, or a rolling 20-, 40-, or 65-day low. Clean. Objective. Repeatable.
Does the Golden Cross Offer Any Edge?
Let’s test the golden cross historically on the S&P 500:
• Since January 2000, there have been 11 prior golden cross events.
• If a trader had bought the S&P 500 on the day of the signal and held for 50 trading days, they would’ve been in the money 9 out of 11 times (82% win rate), with an average gain of 5%.
• The two losing trades averaged a loss of -0.9%.
So yes, historically the golden cross aligns with further gains on average, but the sample size is statistically insignificant, and the signal is lagging by design. Take the last golden cross on 2 February 2023 – the S&P 500 reversed sharply on the same day and fell 9.2% over the next 26 days.
Why It Offers No Edge For Shorter-Term CFD Traders
For short-term traders, especially in CFDs, the golden cross is too slow and lacks actionable timing precision. Markets today are far more dynamic, and the structure has changed dramatically:
• High-frequency trading (HFT) now accounts for 70–80% of S&P 500 daily volume.
• 0DTE options dominate, making up over 50% of daily notional options turnover.
• Leverage ETF flows, passive indexing, and rebalancing increasingly drive intraday volatility.
Add to that the constant real-time influence of Trump’s social media posts, pending macro catalysts (like the OBBB Act, U.S. Q2 earnings season starting July 15), and economic data-driven market reactions, and it’s clear: price leads, it's the first derivative, MA's simply follow.
Conclusion
Yes, historically golden crosses coincide with further gains. But for short-term traders, especially those using CFDs, this signal offers no real edge. Instead, focus on faster momentum signals, reactive price-based strategies, or MA systems with a tighter lookback period.
The material provided here has not been prepared in accordance with legal requirements designed to promote the independence of investment research and as such is considered to be a marketing communication. Whilst it is not subject to any prohibition on dealing ahead of the dissemination of investment research we will not seek to take any advantage before providing it to our clients.
Pepperstone doesn’t represent that the material provided here is accurate, current or complete, and therefore shouldn’t be relied upon as such. The information, whether from a third party or not, isn’t to be considered as a recommendation; or an offer to buy or sell; or the solicitation of an offer to buy or sell any security, financial product or instrument; or to participate in any particular trading strategy. It does not take into account readers’ financial situation or investment objectives. We advise any readers of this content to seek their own advice. Without the approval of Pepperstone, reproduction or redistribution of this information isn’t permitted.