What is share CFD trading and how to get started?
Pepperstone only offers CFDs over this asset meaning there is no ownership of the underlying asset. Share CFDs trading via Contracts for Difference (CFDs) involves speculating on the price movement of equities of publicly listed companies without owning the underlying asset.
How do you trade Share CFDs?
To begin trading share CFDs, prospective investors must open a brokerage account with a well-regarded CFD broker.
After successfully establishing the account, investors are encouraged to conduct comprehensive research and thorough analysis of the underlying assets to understand the market. These steps are crucial in making well-informed investment choices. Investors can start on a demo account before opening a live trading account.
When prepared, investors can proceed by executing orders through their chosen broker to either buy (long) or sell (short) CFDs across a wide range of underlying share CFDs.
How do macroeconomic factors influence global share CFD markets?
A share CFD's price is influenced by numerous elements, including the strength of the underlying company’s balance sheet, future prospects, broader economic conditions, and the prevailing attitudes of investors.
Understanding how macroeconomic factors influence the share CFD market is crucial, as these elements significantly affect market performance, returns and, ultimately, the price movement of the asset.
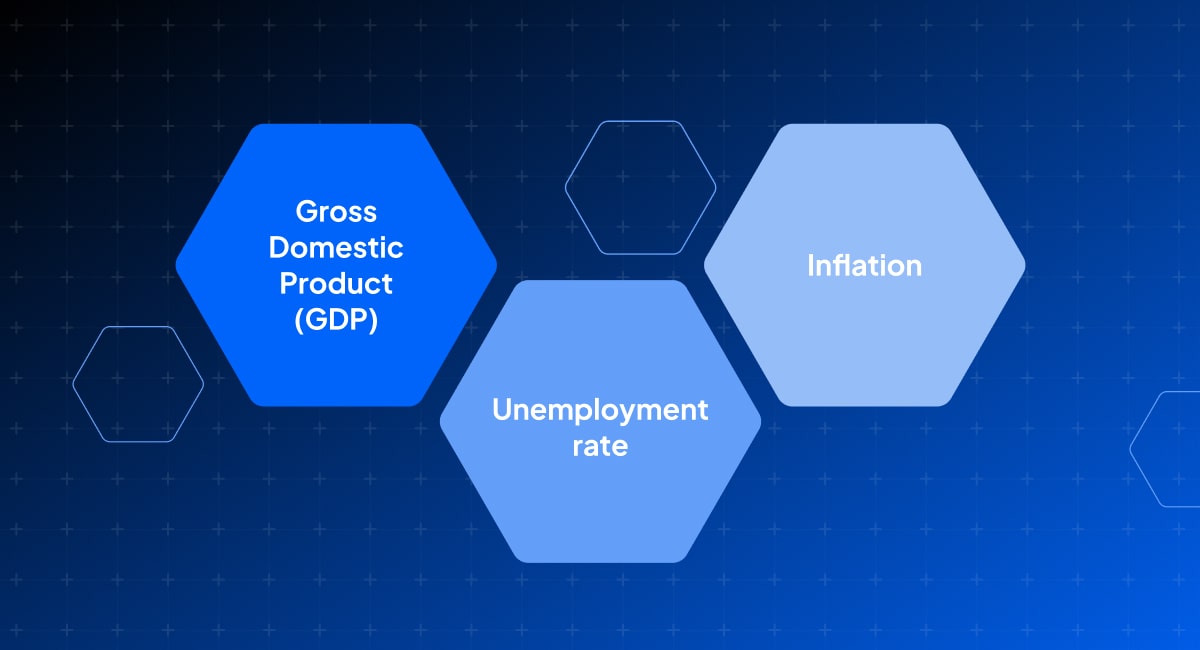
Investors should, therefore, be mindful of several essential economic indicators to refine their risk management strategies, including:
Gross Domestic Product (GDP)
GDP stands as the most all-encompassing economic indicator, capturing the total value of all goods and services produced within a nation over a specified period. It serves as a fundamental measure of economic growth or contraction, thereby indicating the overall economic health.
Unemployment rate
Employment metrics, such as the unemployment rate, play a pivotal role in share CFD market analysis. Similar to GDP, the unemployment rate is indicative of economic strength or weakness. For example, the US Bureau of Labor Statistics’ monthly jobs report provides insights into hiring trends, which can forecast future economic activity levels, while in the UK the Office for National Statistics provides the equivalent data.
Inflation
Rising inflation can dampen consumer spending—accounting for more than two-thirds of GDP—and may prompt the Federal Reserve to raise interest rates to manage price stability. Elevated interest rates typically curb economic activity and can halt share CFD market rallies. Conversely, declining inflation often leads to lower interest rates, potentially sparking share CFD market growth.
What is the difference between a bull market and a bear market?
A bull market signifies a sustained uptrend in the financial markets, characterised by rising share CFD prices and often coinciding with periods of robust economic growth and increased employment.
Conversely, a bear market indicates a significant downturn, marked by falling share CFD prices and typically associated with economic contraction and higher unemployment rates.
In a thriving bull market, the overall economic conditions are positive, which can lead to a continuous rise in the value of share CFDs. Investors generally exhibit confidence that this upward momentum will persist, reflecting a strong economy with high job creation and consumer spending. The optimistic sentiment of investors further propels the market upward, reinforcing the cycle of growth.
On the other hand, a bear market is identified by a sustained decline in share CFD prices, usually defined by a drop of 20% or more from recent peaks. This decline often mirrors a weakening economy, where companies face lower revenues and profits, which may prompt layoffs, increasing unemployment. The prevailing pessimism among investors during a bear market exacerbates the downward trajectory, as fears of further economic deterioration lead to more selling.
Understanding these market dynamics helps investors navigate the financial landscape, enabling them to make informed decisions based on prevailing economic indicators and market trends.

How can I manage risk when trading share CFDs?
Effective risk management is fundamental to long-term returns when trading stock CFDs. It encompasses the identification, analysis, and management of uncertainties inherent in investment decisions. In essence, risk management when trading share CFDs revolves around making calculated decisions to curtail losses and safeguard capital.
Central to risk management is the practice of capping positions so that a significant market shift or a series of losses remains manageable. The goal is to ensure that losses are within a bearable range, leaving enough capital to recuperate through future profitable investments.
Achieving long-term profitability in when trading share CFDs hinges on a combination of factors:
- The ratio of winning trades to losing trades (volume).
- The average profit per trade versus the average loss per trade (value).
Risk management employs various tactics, such as setting stop-loss orders, determining appropriate position sizes, and diversifying investments across different assets. These strategies help investors establish limits on potential losses per trade or over a certain period.
What is a share CFD?
Contracts for difference (CFDs) are a type of Over The Counter (OTC) financial instrument that enables investors to speculate on the price fluctuations of various assets such as foreign exchange (forex), equities, and commodities without the necessity of actually owning those assets.
It is important to note that non-leveraged, traditional share trading is not offered by Pepperstone. Only leveraged trading via stock CFDs is offered through Pepperstone, which allows investors to speculate on the price movements of various assets.
What are the different strategies for trading share CFDs?
A trading strategy is the foundation for a measured approach for engaging in trading share CFDs, encompassing predefined rules and criteria to inform buying and selling decisions.
Trading strategies can vary greatly in complexity. They might consider factors such as investment style (like value versus growth companies ), company size (market capitalisation), technical analysis, fundamental analysis, industry sectors, portfolio diversification levels, investment duration, risk tolerance, leverage usage and more.
Crucially, a trading strategy should be grounded in objective data and analysis and consistently followed. Nevertheless, it should also be revisited and adjusted periodically to reflect evolving market conditions or shifts in personal financial objectives.
There is a wide array of trading strategies and techniques available. The diversity of these methods allows people from various backgrounds to find an approach that suits their preferences and goals, making participation in financial markets accessible to many.
Trading strategies can be categorised into different types, each with its unique characteristics and suitable for different time frames and risk appetites. The main types of trading strategies include:
- Trend Trading: Capitalising on the direction of market momentum.
- Range Trading: Profiting from predictable price oscillations between support and resistance levels.
- Breakout Trading: Identifying and trading securities that are poised to move beyond established resistance or support levels.
- Reversal Trading: Betting on the direction change of a security's price after a peak or trough.
- Gap Trading: Exploiting price gaps that occur when a share CFD opens significantly higher or lower than its previous closing price.
- Pairs Trading: Engaging in market-neutral trading by pairing long and short positions in two correlated securities.
- Arbitrage: Taking advantage of price discrepancies between different markets or forms of the same asset.
- Momentum Trading: Investing in securities that show strong recent performance with the expectation that this momentum will continue.
IPOs can be very popular with share CFD traders, and Pepperstone has compiled a list of upcoming IPOs in 2025.
What are the benefits of trading share CFDs?
Trading share CFDs present numerous benefits compared to traditional share CFD trading, such as:
- Utilising leverage: With CFDs, investors can leverage their investments, allowing them to manage larger positions with a smaller capital outlay. This can significantly increase potential profits, though it also heightens the risk of losses.
- Profiting from declining markets: CFDs facilitate short selling, enabling investors to benefit from falling market prices by selling (shorting) assets.
- Reduced costs: In many regions, CFDs are exempt from stamp duty, lowering the overall cost of transactions.
- Broad market access: CFDs grant investors the ability to access a diverse array of global markets - including share CFDs, indices CFDs, commodity CFDs, and margin forex - through a single platform.
- Lower fees: CFDs incur lower fees and commissions than traditional share CFD trading, as costs are often confined to the spread (the difference between the buying and selling price).
- Avoidance of asset ownership hassles: When trading CFDs, investors do not take ownership of the underlying asset, sidestepping the logistical challenges and expenses associated with ownership, such as storage and insurance for physical commodities.
- Strategic hedging: Investors can utilise CFDs to hedge against potential losses in their existing portfolios. For instance, they can short sell CFDs to protect against declines in the value of their share CFDs holdings.
- Round-the-Clock trading: Many CFD platforms offer 24-hour trading, allowing participants to respond to news and global developments outside regular market hours.
What are the risks in trading share CFDs?
Trading share CFDs carries a myriad of risks that investors need to be aware of, such as:
- Leverage: Trading shareCFDs enables investors to leverage their positions, allowing control over a large amount of share CFD with a smaller capital outlay. This leverage can significantly magnify both gains and losses. Even minor adverse market movements can lead to substantial losses that exceed the initial investment.
- Market volatility: Share CFD prices are highly volatile and sensitive to market fluctuations. Unexpected market changes can result in rapid and significant losses.
- Liquidity risk: Certain share CFDs may lack liquidity, making it challenging to buy or sell at desired prices. This lack of liquidity can cause slippage, where trades are executed at prices different from those anticipated, leading to unanticipated losses.
- Margin call risk: If market conditions turn against an investor’s share CFD position, their broker might demand additional funds to maintain the margin. Failure to meet these margin calls can result in the broker closing their positions, often at a loss.
What is margin trading and how does it work when trading share CFDs?
Margin trading involves a trader’s deposit being magnified or geared by their broker.
The allure of margin trading lies in its potential for higher returns compared to traditional share CFD trading. By leveraging, investors can amplify their gains. However, this also means that any losses are equally magnified, making it a high-risk strategy.
Margin trading effectively uses leverage to enhance the impact of your investment decisions.
In essence, margin trading requires a margin deposit, which is a portion of the total trade value that serves as collateral. This margin deposit is determined by the margin rate, expressed as a percentage of the total trade value.
Example:
Imagine an investor wants to purchase 10 share CFDs of Nvidia share priced at $100 per share CFD. In standard trade, an investor would pay the full $1000 upfront in exchange for the 10 share CFDs.
However, with a margin rate of 20%, the investor would only need to deposit $200 to gain exposure to the entire $1000 value of the share CFDs.
This allows investors to control a larger position with a smaller initial investment, highlighting both the advantages and risks associated with margin trading.
How can I use leverage effectively in my share CFD trading strategy?
Leverage is often represented as a ratio, such as 5:1, 10:1, or even higher. A 10:1 leverage indicates that for every $100 of the investor’s capital, they can open a $1,000 position, significantly increasing their position.
To put that into context, with 10:1 leverage, an investor can gain an exposure of 500 share CFDs of a Lloyds share CFD valued at $20 each, amounting to a $10,000 position, compared to just 50 shares without leverage.
Now imagine that the share CFD price appreciates by 10% to $22 per share CFD.
Without leverage: The investor holds 50 share CFDs. The total investment becomes $1,100 , yielding a profit of $100.
With leverage: The investor holds 500 share CFDs. The total investment value reaches $11,000..
This example highlights how leveraged share CFD trading can significantly boost profits. However, it also poses substantial risks, potentially causing severe losses, especially when utilising higher leverage levels as while any gains are quickly magnified, so are losses.
How do I perform advanced technical analysis on share CFDs?
Technical analysis involves evaluating price movements over a defined period with the aim of predicting market trends. While forecasting the market is challenging, by utilising charts it can provide investors with valuable insights. Further, advanced techniques in technical analysis often incorporate multiple indicators or methodologies to enhance market predictions, including:
Trading charts
Chart patterns are foundational to technical analysis. Analysts rely on various charts to gather essential data. The main chart types include line charts, bar charts, candlestick charts, and point and figure charts, each serving different trading objectives.
Technical analysts use chart patterns to identify potential trading signals, as they believe certain patterns recur and yield similar results. This foundational understanding allows traders to effectively analyse daily and intraday charts, avoiding the misleading nature of short-term views when isolated.
Support and resistance
Support and resistance levels are key concepts in technical analysis. These levels indicate points where the market price struggles to move beyond a specific level.
Support levels form when a declining market hits a low and rebounds, while resistance levels occur when a rising market reaches a high and then falls back.
Investors use these levels to make informed trading decisions and anticipate trend reversals.
Correlation
The relationship between the movements of different share CFDs is another important aspect of technical analysis. share CFDs with movements that consistently follow each other are positively correlated. For instance, rising oil prices often lead to higher gas prices. Conversely, negatively correlated share CFDs move in opposite directions. Understanding these correlations is beneficial for portfolio diversification, as non-correlated share CFDs can offset losses within a portfolio.
Moving averages
Due to the volatile nature of price movements, interpreting chart patterns can be challenging. Moving averages help by smoothing out daily fluctuations, making trends more discernible and aiding in the identification of support and resistance levels.
The simple moving average is the most common type, with other variations including the exponential moving average and the linear weighted moving average. Common periods for calculating moving averages are 50, 100, or 200 days, offering varying degrees of trend visibility.
What is pair trading with share CFDs and how can I identify good pairs?
Pairs trading is a sophisticated investment technique that aims to profit from the relative price movements between two related financial instruments. Unlike traditional trading strategies, it does not depend on the overall market direction.
In practice, this strategy involves purchasing the undervalued asset while short-selling the overvalued one, thus ensuring a neutral stance regarding market movements. This is why pairs trading is also known as a market-neutral or statistical arbitrage strategy.
The chosen securities can originate from the same sector or from different markets, provided they exhibit a strong positive correlation.
To implement a pairs trade, the initial step is to identify two securities with a high degree of correlation. For instance, the S&P 500 and the Dow Jones Utilities Average are two indices CFDs that frequently move in tandem. Analysing their historical price movements can provide insight into their correlation and potential trading opportunities.
What are the challenges and opportunities of trading share CFDs in emerging markets?
Emerging markets, typically located in developing regions, are known for their rapid economic growth, increasing productivity, expanding populations, and rising industrialisation.
These markets present a mix of opportunities and risks due to their higher volatility compared to established markets. The financial infrastructures and regulatory frameworks in these regions are often less mature, adding an element of uncertainty for investors.
What is an example of share CFD trading using a CFD?
Imagine an investor wants to purchase 10 share CFDs of Tesla priced at $100 per share CFD. In this scenario, an investor would pay the $1,000 in exchange for the 10 Tesla share CFDs.
A week later, the underlying share CFD price increased to $150 per share CFD. If the investor sells their 10 Tesla share CFDs at this new market price, they will receive $1,500, representing a $500 profit.
Trading Share CFDs - Upside Example:
Now, let's consider that an investor decides to trade Nvidia share CFD using CFDs with leverage.
This investor wants to trade CFDs on 10 share CFDs of Nvidia share CFD, also priced at $100 per share CFD. However, instead of paying the full $1,000, the investor uses leverage. Let's assume a leverage ratio of 10:1 (meaning the investor only needs to provide 10% of the trade value as margin).
For a position worth $1,000 (10 share CFDs x $100), the investor only needs to put down $100.
A week later, the underlying share CFD price increased to $150 per share CFD. The value of the CFD position now mirrors the new share CFD price, so the position is worth $1,500 (10 share CFDs x $150).
The investor then decides to close the CFD position at this point to lock in their profit. The profit is calculated as the difference between the closing value and the opening value of the position:
- Opening value: $1,000
- Closing value: $1,500
- Profit: $1,500 - $1,000 = $500
It’s important to note that trading share CFDs can offer significant profit potential but also carries a higher risk of substantial losses. Investors should be aware of these risks and manage their trades accordingly.
Trading share CFDs - Downside Risk Example:
Imagine an investor wants to purchase 10 share CFDs of Nvidia priced at $100 per share CFD. Instead of paying the full $1,000, the investor uses leverage with a ratio of 10:1, meaning they only need to provide 10% of the trade value as margin. For a position worth $1,000 (10 s x $100), the investor only needs to put down $100.
A week later, the underlying share CFD price decreased to $50 per share CFD. The value of the CFD position now mirrors the new share CFD price, so the position is worth $500 (10 share CFDs x $50). The investor decides to close the CFD position at this point to prevent further losses. The loss is calculated as the difference between the opening value and the closing value of the position:
Opening value: $1,000
Closing value: $500
Loss: $1,000 - $500 = $500
Impact on Investor:
Initial investment (margin): $100
Loss: $500
Since the investor only put down $100, the loss of $500 would mean the investor loses their entire margin. However, with negative balance protection for retail clients, the loss cannot exceed the capital used to trade, ensuring the investor does not owe additional funds to the broker.
Share CFD FAQs
What is a share CFD exchange?
A share CFD exchange serves as a marketplace where share CFDs of publicly listed companies are traded. The share CFD exchange acts as an intermediary, ensuring a secure and regulated trading environment.
This centralised platform not only facilitates buying and selling of share CFDs but also provides transparency through real-time price information and trading volume data.
Investors benefit from the share CFDexchange's role in maintaining fair practices and market integrity, promoting liquidity and investor confidence. share CFD exchanges play a crucial role in the global economy by fostering efficient capital allocation and enabling companies to raise funds for growth and innovation.
Examples of share CFD exchanges
- New York Share CFD Exchange (NYSE)
- London Share CFD Exchange (LSE)
- Euronext
- Shanghai Share CFD Exchange (SSE)
It is important to note that share CFDs as OTC derivatives are not centrally cleared through share CFD exchanges, but rather from liquidity providers who will make a market to mimic these exchanges in order to trade share CFDs.
What is a share CFD?
Share CFDs are financial instruments that represent ownership in a company, providing shareholders with entitlements to the company's earnings and assets.
Investors typically buy share CFDs with the expectation that their value will appreciate over time, reflecting optimism about the company's growth prospects and profitability. As the company prospers, the value of its share CFD tends to rise, allowing shareholders to potentially sell their holdings at a profit.
It is important to note that for share CFDs, you don't own or have rights in the underlying asset, simply the ability to speculate on the price movement of the underlying asset.
What is a ticker symbol?
A stock symbol functions as a condensed identifier for publicly traded corporations. When a company opts to become publicly traded, it first designates the share CFD exchange where its share CFDs will be listed. Subsequently, the company carefully selects a distinct stock symbol to distinguish itself clearly among the multitude of other companies trading on that particular exchange. This symbol not only serves as a unique marker but also plays a crucial role in facilitating efficient trading and investment activities within the financial markets.
Examples of share CFD ticker symbols:
- Apple [NASDAQ: AAPL]
- Nvidia [NASDAQ:NVDA]
- BP [LON: BP]
- Shell [LON: SHEL]
How to start trading share CFDs?
To embark on share CFD trading CFDs, prospective investors must open a brokerage account with a well-regarded broker.
After successfully establishing the account, investors are encouraged to delve into comprehensive company research and conduct thorough financial analyses. These steps are crucial in making well-informed investment choices. Investors can start on a demo account before opening a live trading account.
What are trading hours?
Global share CFD markets operate on varying schedules according to their respective time zones, including:
New York Share CFD Exchange and NASDAQ: 9:30 AM - 4:00 PM (Eastern Time)
London Share CFD Exchange: 8:00 AM - 4:30 PM (Greenwich Mean Time)
Euronext (Paris, Amsterdam, Brussels, Lisbon): 9:00 AM - 5:30 PM (Central European Time)
Pepperstone offers investors extended trading services, meaning they can continue to trade in some markets even when those are officially closed, providing them with greater flexibility and opportunities.
Can you sell share CFD after hours?
Peppersone offers investors the advantage of engaging in pre-market and after-hours trading, alongside 24-hour CFD trading on US Share CFDs.
This expanded access is particularly beneficial during earnings season, as it allows investors to react to corporate reports released outside traditional market hours, a time when such disclosures are typically made by US companies.
This enhanced trading functionality includes 24-hour availability for CFD trading on 37 major US Share CFDs, featuring prominent companies like Apple, Tesla, Amazon, Nvidia, among others.
After hours trading from Pepperstone enables investors to capitalise on opportunities beyond the regular trading day, ensuring they can act promptly based on market-moving news and developments.
What tools do I need for share CFD trading?
Pepperstone provides a suite of five robust trading platforms, tailored to fit your specific trading needs, no matter your level of experience. These platforms are accessible at no cost and available across various devices, including mobile, tablet, desktop, and through our web application.
How do I handle the emotional aspects of trading?
Trading psychology encompasses how investors manage their profits and losses, reflecting their capacity to handle risks and adhere to their trading strategies. This psychological aspect is crucial, as emotions can strongly influence trading decisions. An investor’s ability to control these emotions is integral to effective trading psychology.
Common emotional challenges in trading share CFDs include:
- Fear: Many investors experience fear of missing out (FOMO), which arises from the anxiety of potentially losing money or missing lucrative opportunities. This can result in impulsive actions or complete hesitation.
- Greed: The ambition to achieve significant profits can cloud judgement, leading investors to undertake unnecessary risks without proper analysis.
- Revenge trading: Following a loss, some investors may engage in revenge trading, attempting to recover losses swiftly. This approach often results in hasty and poorly thought-out trades, increasing the likelihood of further losses.
- Overconfidence: A series of successful trades can breed overconfidence, causing investors to downplay potential risks and overestimate their market prediction abilities, which can lead to reckless trading decisions.
Understanding and managing these emotional pitfalls are essential for maintaining a disciplined and effective trading strategy. By recognising these tendencies, investors can develop strategies to mitigate their impact, such as setting strict trading rules, maintaining a diversified portfolio, and continually educating themselves about market dynamics.
What is the difference between share CFD trading via a CFD and share CFD brokering?
Investing in the share CFD market can be done through two main avenues: traditional share CFD trading or trading shares via CFDs. However, these methods have notable differences, including:
Ownership
- Traditional share CFD Brokering: Purchasing share CFDs gives you ownership in a company. This ownership includes rights to vote on company matters and receive dividends.
- Trading share CFDs: When trading CFDs, you do not own the actual share CFD. Instead, you are betting on the share CFD's price movements without owning the underlying asset.
Leverage
- Traditional Share CFD Brokering: Buying traditional share CFDs usually means paying the full price upfront. Leverage is minimal or non-existent, which means you need substantial capital to make large investments.
- Trading share CFDs: CFDs offer high leverage, allowing you to control larger positions with a smaller amount of money. This leverage can significantly increase both potential profits and potential losses.
Costs and fees
- Traditional Share CFD Brokering: Typically, buying and selling share CFDs incurs commission fees. These can vary depending on the brokerage but are generally a fixed cost per transaction.
- Trading share CFDs: When trading share CFDs, the costs involved can vary depending on the type of account. Razor accounts typically charge a commission, while Standard accounts include these costs within the spreads (the difference between the buy and sell price). Additionally, there may be other fees, such as overnight financing costs, which can accumulate if positions are held for an extended period.
By understanding these differences, investors can make more informed decisions about which method aligns best with their financial goals and overall risk tolerance
The material provided here has not been prepared in accordance with legal requirements designed to promote the independence of investment research and as such is considered to be a marketing communication. Whilst it is not subject to any prohibition on dealing ahead of the dissemination of investment research we will not seek to take any advantage before providing it to our clients.
Pepperstone doesn’t represent that the material provided here is accurate, current or complete, and therefore shouldn’t be relied upon as such. The information, whether from a third party or not, isn’t to be considered as a recommendation; or an offer to buy or sell; or the solicitation of an offer to buy or sell any security, financial product or instrument; or to participate in any particular trading strategy. It does not take into account readers’ financial situation or investment objectives. We advise any readers of this content to seek their own advice. Without the approval of Pepperstone, reproduction or redistribution of this information isn’t permitted.