How to trade the Non-Farm Payrolls (NFP) report
Employment data influences both monetary and fiscal policy, impacts financial markets and helps businesses make informed investment decisions. This guide aims to help make informed decisions when trading data related non-farm payrolls.
What is the Non-Farm Payrolls (NFP) report?
The Non-Farm Payrolls (NFP) report is a key economic indicator that provides a comprehensive picture of the employment situation in the United States. It is considered to be one of the most important economic indicators on the global macroeconomic calendar and as such is normally a catalyst for high volatility in certain assets. Thus it provides traders with an opportunity for significant price moves.
Non-farm payrolls cover approximately 80% of the workers in the United States. It excludes farm workers (as the title suggests), private households, government employees and non-profit organisations.
When is the NFP report released?
The NFP report is released by the U.S. Bureau of Labor Statistics on the first Friday of every month at 8.30 AM Eastern Time (ET) in the United States (13:30 PM GMT) but may differ when the UK switches to British Summer Time earlier or later than the United States.
To get access to news feeds with timely data releases. Free aggregation platforms like PiQ offer over 100 sources of information from the likes of Reuters and Bloomberg.
What is the relationship between the NFP and economic indicators?
NFP gives an important insight into the United States’ economic health, as jobs (and the creation of jobs) are key to the medium to long-term economic outlook. The NFP is pivotal for a number of key economic indicators:
- Gross Domestic Product (GDP) - As jobs are created it generally leads to increases in production and economic output. Strong NFP numbers indicate increased employment which can be a catalyst for consumer spending and production impacting GDP positively.
- Unemployment Rate - The NFP report has a direct impact on the unemployment rate. Positive NFP numbers normally lead to a decrease in the unemployment rate pointing to a healthy labour market and economy.
- Inflation - Within the NFP release are average hourly earnings (AHE) which gives an indication of wage growth which has a direct impact on inflation. Higher wages mean a greater willingness to spend, boosting consumer confidence. On the flip side, weak numbers can lead to a reduction in consumer spending and economic activity.
- Business Investment - Businesses tend to respond to changes in labour market conditions when making investment decisions. The more confident businesses are in the economy the more likely they are to invest during periods of expansion. Conversely, during periods of job cuts some businesses may decide to curtail investment.
Other data to track in the run up to non-farm payroll to get a steer of the number may include, Weekly jobless data, ADP employment changes and employment constituents of the monthly ISM and PMI data.
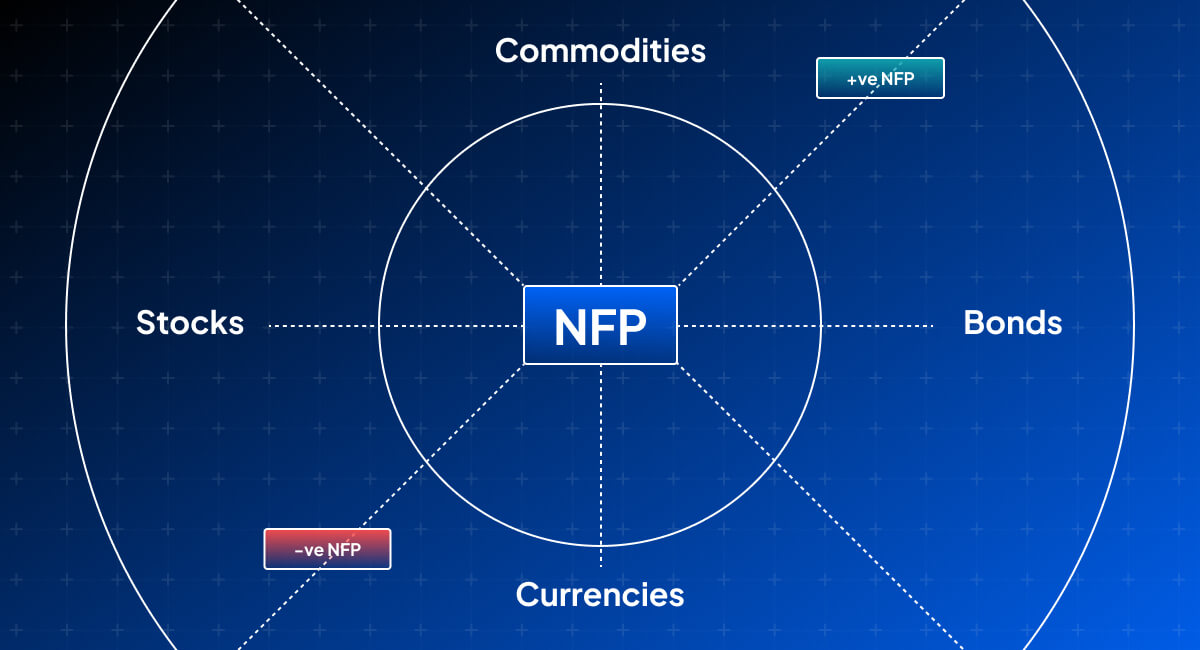
How does NFP affect the financial markets?
Although NFP data is more intensely followed by margin FX traders it affects virtually all financial markets. It affects financial markets through its influence on economic growth forecasts, interest rate expectations and sentiment. Positive reports usually provide a positive catalyst for equity markets, bond yields and the USD. Negative reports can have the opposite effect. As a general rule of thumb the US needs to add more than 100,000 new jobs per month just to keep pace with growth in the working age population.
During normal interest cycles a significantly bigger NFP headline number than expected may lead to expectations of an economy in danger of overheating, leading to the prospect of inflation. This leads to the market focusing on the threat of potential rate hikes which would be a headwind for stocks but USD positive as it raises yields, making US Treasuries more attractive and subsequently more demand for USD to buy those assets.
It is important to note that these are general guidelines and the reaction can vary according to the economic context within which the numbers are delivered. For instance, it is not uncommon for the USD to strengthen on a bad number. It depends on the state of the economy at the time and how the number is perceived, noting that past performance is no guarantee of future results.
During the period of zero (or negative) interest rates policy (ZIRP/NIRP), a weaker than expected number often led to a positive reaction in equity markets, as investors and traders extrapolated that the Federal Reserve would be forced to react and provide more stimulus in the form of quantitative easing. This, in turn, strengthened the bond market through lower yields, leading to a weaker USD and a stronger stock market.
Another scenario to consider where the opposite reaction may occur is during periods of recessions and high unemployment. During such periods the Federal Reserve could lower interest rates thus reducing demand for USD causing it to fall.
What is the relationship between NFP and currency values?
The NFP release has wide reaching market implications but the reaction is most notable in the currency markets. There are a number of strategies and chart patterns that can be utilised to take advantage of price swings. Currency pairs are the most popular instruments to trade. The most popular major currency pairs include GBP/USD, EUR/USD, AUD/USD and USD/JPY which experience heightened trading activity around the release. Minor and exotic pairs also experience major volatility but predicting the direction of trade can be more challenging.
The biggest reaction tends to happen in EUR/USD, GBP/USD and USD/JPY. The premise is that if NFP is strong and we get a better number, then the USD will strengthen. Those pairs where the USD is the base currency will strengthen; and those where the USD is the quote currency will weaken. Conversely, expect the opposite reaction if the number is weaker.
Aside from those currency pairs which are affected directly there is also an indirect reaction in the markets due to the USD relationship with commodity CFD prices. Commodity CFD markets are priced in USD, as the USD strengthens it means more commodity CFD can be purchased by the same amount of USD leading to a fall in commodity CFD prices and vice versa for weaker USD.
How can you prepare for NFP trading?
No trading is without the potential for risk of loss of capital. Preparation then is key to getting a positive outcome from any trading. Consider Pepperstone’s 5 ‘R’s of Trading Preparation to prepare for trading:
Pepperstone’s 5 ‘R’s of Trading Preparation
- Research - Researching the markets and keeping track of newsflow. Use platforms such as PiQ and X. Greater understanding of what makes asset prices fluctuate, the greater the chances of identifying trading opportunities.
- Realistic - Be realistic and learn to understand risk and reward per trade. Successful traders have a profit and loss goal before entering a trade. Practice on a demo account.
- Risk - Work out risk tolerance. Risk management tools are available on the Pepperstone trading platforms.
- Record - Keep a paper or free online trading journal such as TradeBench. Learn from experience. A journal can be as detailed as required but at the bare minimum it should cover the reason behind the trade, profit target/maximum loss & entry/exit levels.
- Rudimentary - Keep it simple. There is no need for complicated algorithms or game theory scenarios. A straightforward and easy to execute strategy according to risk tolerance and trading objectives can be just as if not more profitable.
Pepperstone provides comprehensive previews to help prepare for all major market moving events including NFP. Follow Pepperstone’s senior analysts Chris Weston (@ChrisWeston_PS) and Michael Brown (@MrMBrown) on X (Twitter) for insight into the various caveats to look out for in the releases. It is also useful to have a “cheat sheet” on hand as a quick reference guide when trading on the day.
Why is it important to keep an eye on the economic calendar and analyse historical data and trends?
Monitoring the economic calendar and analysing historical data and trends are fundamental practices for any serious trader. These practices enable better anticipation of market movements, more effective risk management, strategic planning, and informed decision-making. By understanding and preparing for significant economic events, traders can improve their chances of success and navigate the complexities of financial markets more effectively.
Websites like Trading Economics and the St Louis Fed’s FRED (Federal Reserve Economic Database) provide comprehensive calendars with user-friendly charts to help analyse trends.
Anticipate Market Movements
- Economic Calendars: Provide a schedule of upcoming economic events and data releases, such as the NFP report, which can cause significant market volatility. Knowing when these events are scheduled allows traders to prepare for potential price movements.
- Historical Data: Helps traders understand how the market has reacted to similar events in the past, providing insights into possible future reactions.
Risk Management
- Volatility Awareness: Economic events like the NFP release often lead to increased volatility. Being aware of these events in advance helps traders adjust positions, set appropriate stop-loss levels, and manage leverage to protect against unexpected price swings.
- Avoiding Surprises: Analysing the economic calendar and being aware when market news events are to occur ensures traders are not caught off guard by major announcements that could lead to significant market moves against positions.
Market Sentiment
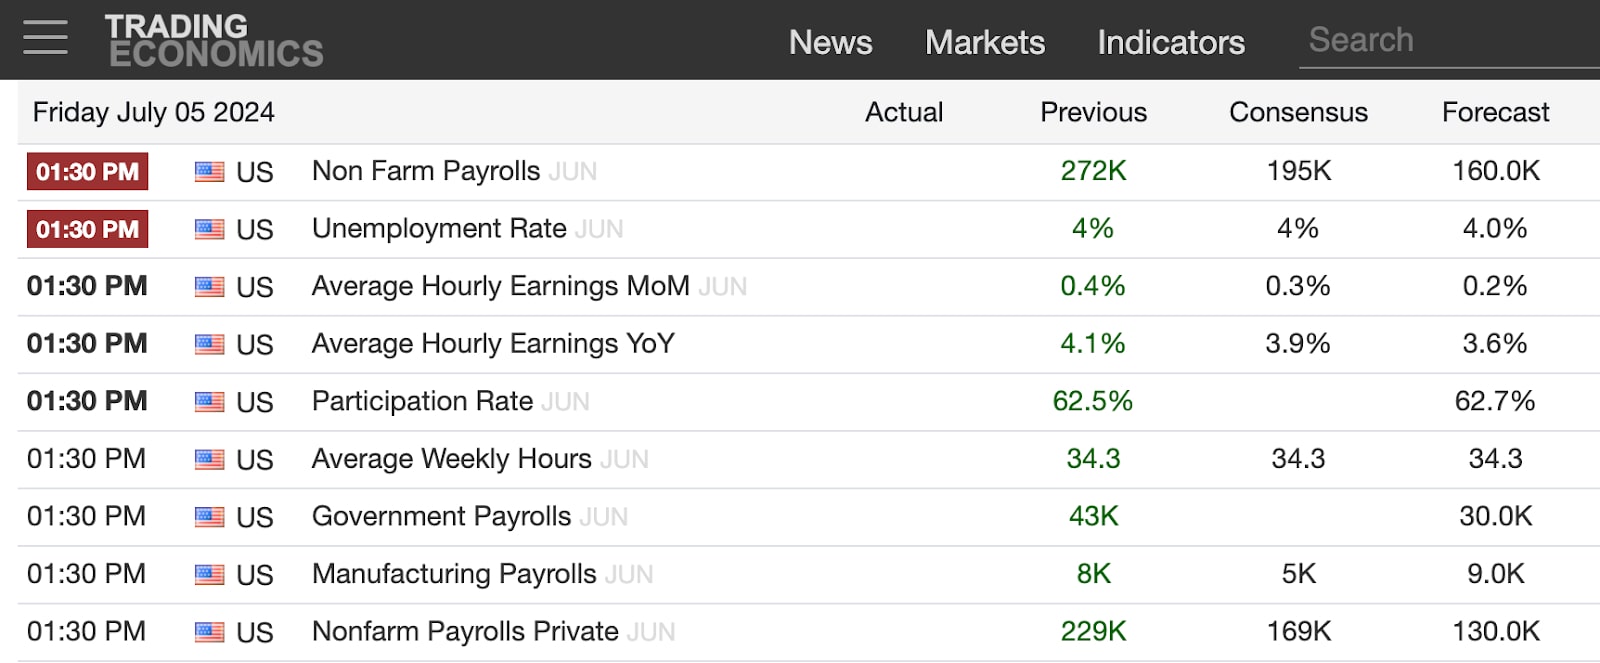
- Expectation Management: Economic calendars usually provide forecasts and consensus estimates for upcoming data releases (see below). Comparing actual results to these expectations helps traders gauge market sentiment and potential reactions.
- Sentiment Shifts: Significant deviations from expectations can lead to shifts in market sentiment, causing trends to reverse or accelerate. Being prepared for these shifts is essential for effective trading.
Economic Context
- Comprehensive Analysis: Analysing historical data within the broader economic context can help traders understand the underlying reasons for market movements. This includes how different economic indicators interact and impact financial markets.
- Informed Decisions: Having a thorough understanding of economic conditions allows traders to make more informed decisions rather than relying solely on technical analysis.
Enhanced Technical Analysis
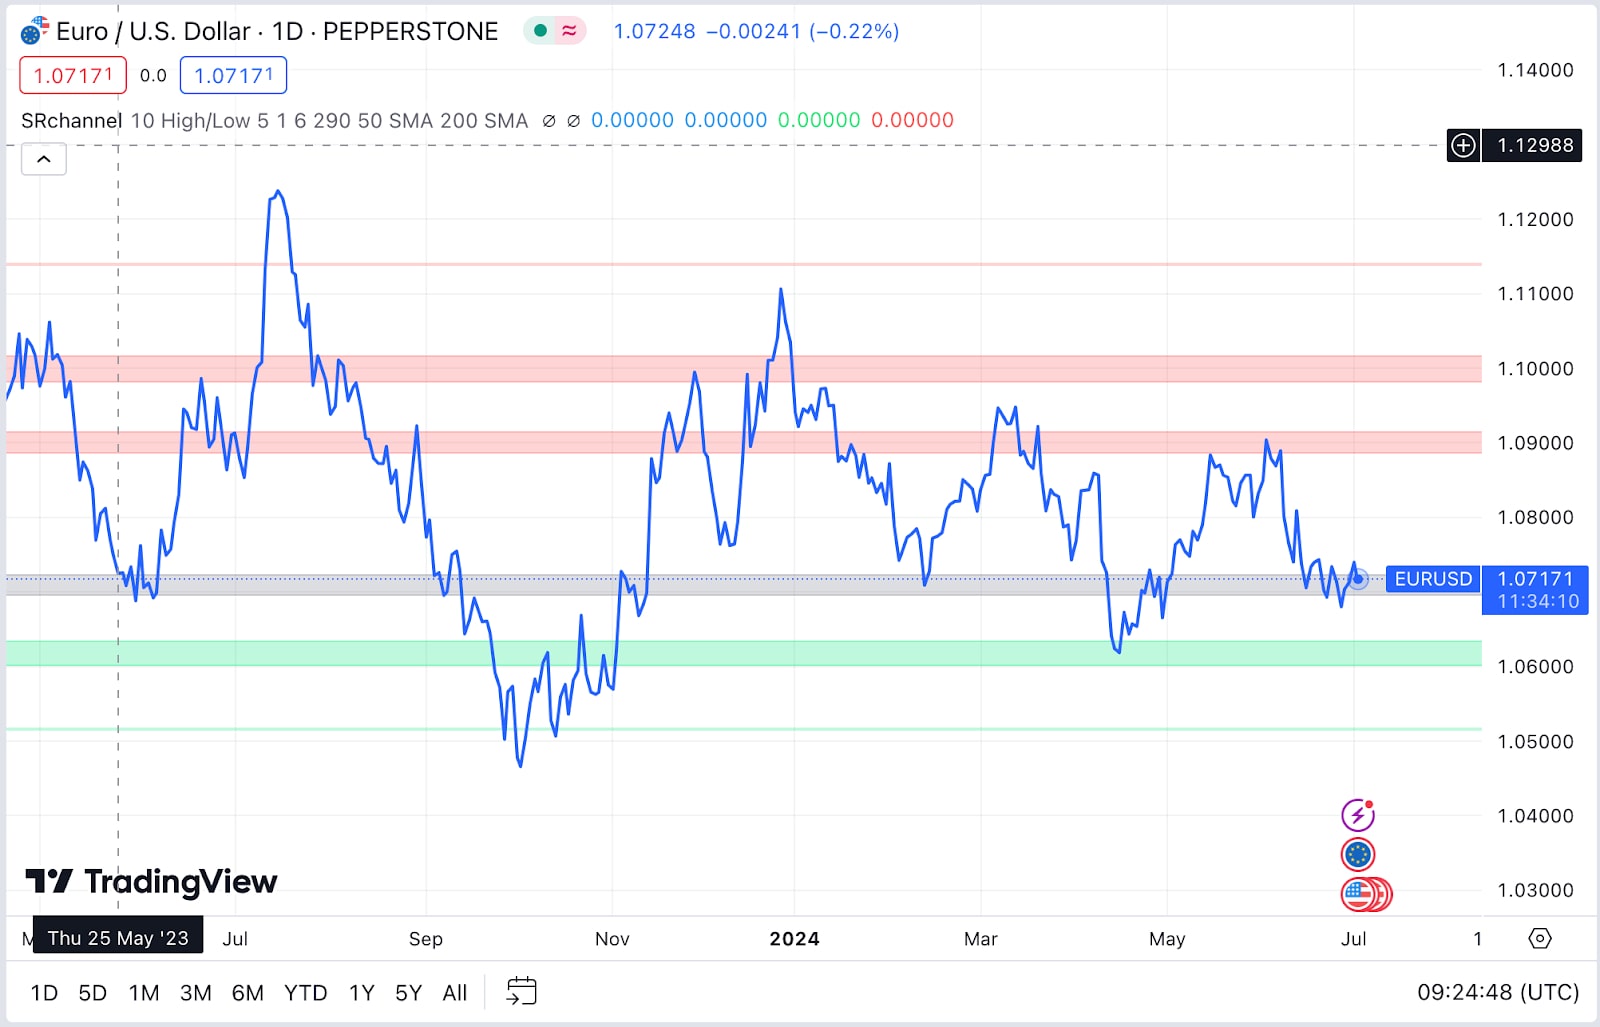
- Support and Resistance Levels: Historical data helps identify key support and resistance levels (chart below uses support and resistance levels available from a widely followed trader on TradingView) that are likely to influence future price movements. These levels often align with past reactions to major economic events.
- Indicator Validation: Comparing technical indicators against historical data improves their reliability. For example, confirming that certain indicators have accurately predicted past reactions to NFP releases can enhance their credibility.
How do you set up a trading plan?
With a clear and defined plan it is easier to remain focused on trading objectives. Many make the mistake of investing a lot of time in creating a strategy, but then discard it when beginning to trade the markets.
- Choose a currency pair - EUR/USD typically has the narrowest spread of any currency pair because it is the most actively traded in the world. GBP/USD is also heavily traded but the spread is usually wider and also tends to have higher daily movement than the EUR/USD. The EUR/USD has an average daily movement of around 50 pips, while the GBP/USD moves 70 pips per day (based on a 10-week average). The GBP/USD is moving about 30% more per day. The flip side is that the GBP/USD spread is sometimes substantially wider than the EUR/USD. There’s a tradeoff there. If the GBP/USD and EUR/USD spreads are similar, then GBP/USD may give you more volatility to capitalise on. If the spread is much bigger in GBP/USD, then the EUR/USD is the better option with the lower spread. Check the typical spread with Pepperstone.
- Technicals vs. fundamentals - Most traders will find opportunities using technical or fundamental analysis – or a combination of the both.
- Risk/reward - Discipline is key. Look to risk a maximum of 1-2% of total capital per trade. It is vital to exit if price goes significantly against the trade. Define risk beforehand with stop losses. A lot of traders will hold a losing trade, hoping that it turns around, but the NFP release is an extremely volatile news event and therefore increased risk of price moving sharply against the entry point without retracement. It is far better to take a small loss and preserve capital for future trades than to end up wiping out a large percentage of capital on one trade.
- Timing - There is a well worn phrase passed down through the years by market professionals [that] “the first move is always wrong”. This may not always be the case but it is prudent to let the price action play out and then trade according to the move. With that in mind many traders will trade the market’s expectations and subsequent reaction to those numbers, not the headline numbers themselves.
- Order Type - This will depend on the strategy adopted. It is often considered a better option to place limit orders as opposed to market orders during periods of heightened volatility. Limit orders allow for greater discipline and are enhanced pre-determined risk management tools. Stop loss orders protect against significant losses and are also essential to risk management. A stop loss order automatically sells a position, limiting losses from an unexpected NFP print. The most useful order type for managing risk during the volatility of the NFP release is a bracket order. It is an order that includes a primary order, profit-taking limit and a stop-loss order. Used for automated trade management it allows for a predefined profit target to be set alongside a maximum loss level. One-cancels-the-other (OCO) order is a combination of two orders where if one is executed the other is automatically cancelled. Allows for a strategy to be set up that covers both potential outcomes of the NFP release. For example a buy order could be placed above current market price and a sell order below it. Finally, for traders with longer time frames looking to maintain positions beyond the NFP release, Good ‘Til Cancelled (GTC) orders are useful.
- Exit Strategy - Set profit and stop-loss targets. A typical exit strategy for profit would be 2.5x the stop loss amount. For example, if the stop loss is 4 pips, use a 10 pips profit target. Identify key levels like support and resistance to preset orders automating as much of the process as possible to take emotion out of trading decisions.
What are some strategies for trading NFP?
Whilst the interpretation of the data is important in the broader economic context it is not as important for traders using strategies that rely on this heightened volatility. Mastering trading strategies around NFP provides a real edge. You can check out our guide to day trading here.
Before release:
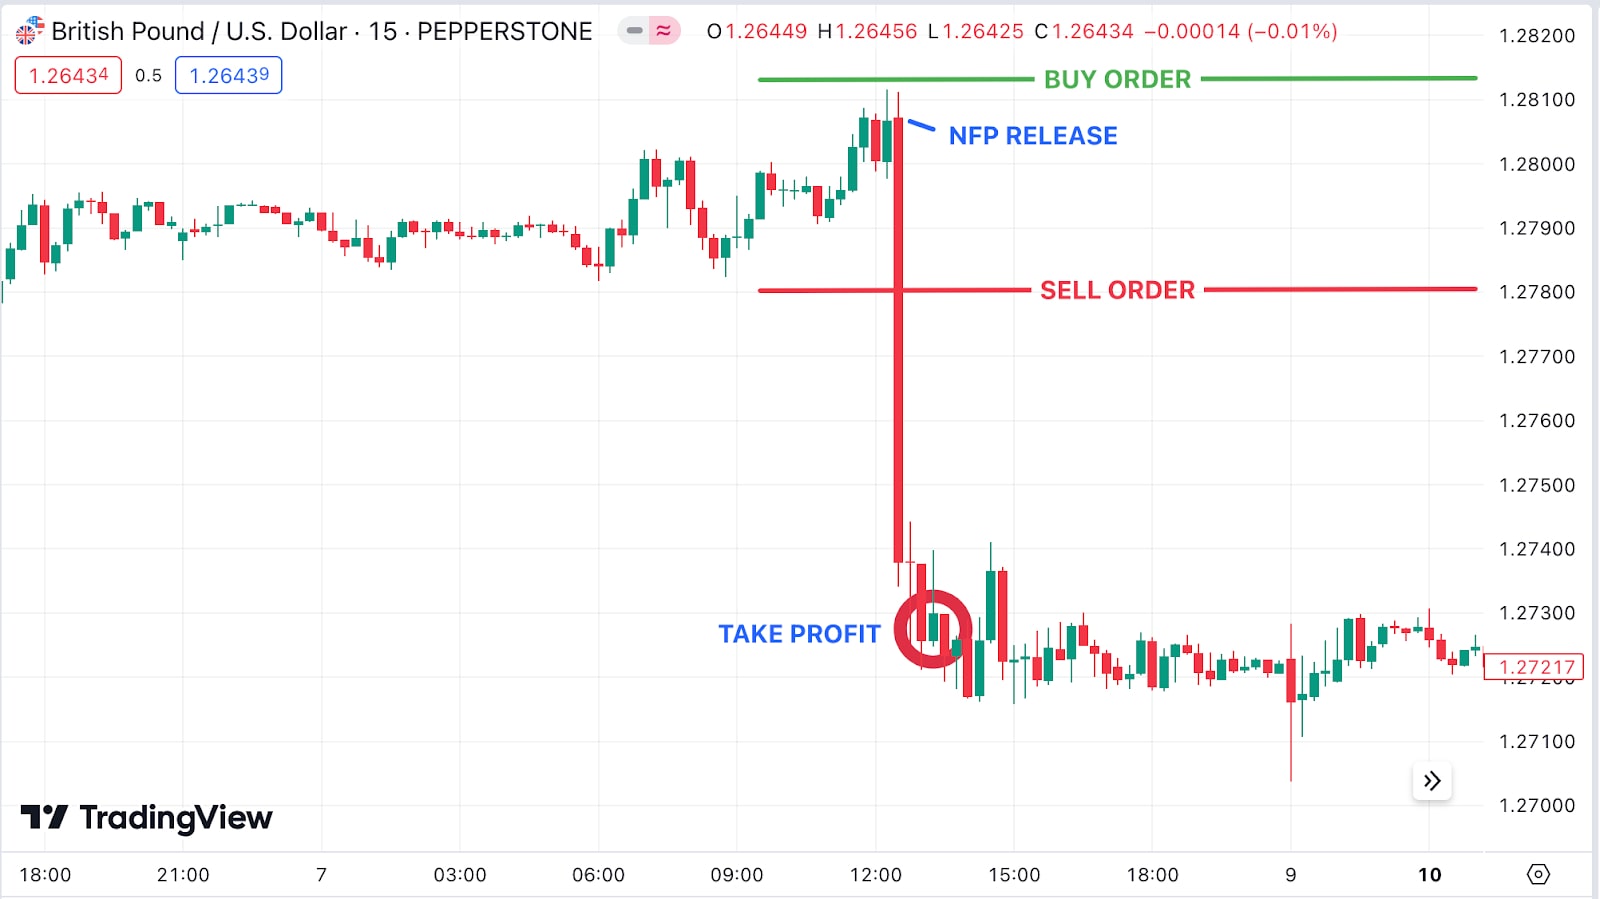
- Range breakout pre-positioning - Some traders use a 90 minute chart to set high and low points (straddle) 10-15 minutes beforehand at 1315-20 GMT/0815-20 ET. Although timeframes are a matter of preference. Under such a scenario sell orders are placed below the low (range low minus one pip) and buy orders above the high (range high plus one pip) on the chart using OCO orders. This strategy is used to enter new trades to take advantage of volatility spikes.
It is important to ensure that protective stop loss orders are placed at the opposite end of the range. Using the above chart as an example, the protective stop for the long entry buy stop is placed below the range (where the short entry stop is). Conversely, the protective stop for the short entry stop is placed above the range (where the long entry stop is).
After the release:
- Trade the fade - For those who prefer to wait for the initial reaction to the NFP release and for the markets to find a level. Often price swings are exaggerated, influenced by high trading volumes and pushed around by automated trading systems. It takes time to digest the data and then make adjustments to trading positions, potentially leading to temporary price reversals. Consider entering a trade opposite to the initial price reaction. This approach requires patience as you wait for the market to settle and the initial buzz of activity calms down.
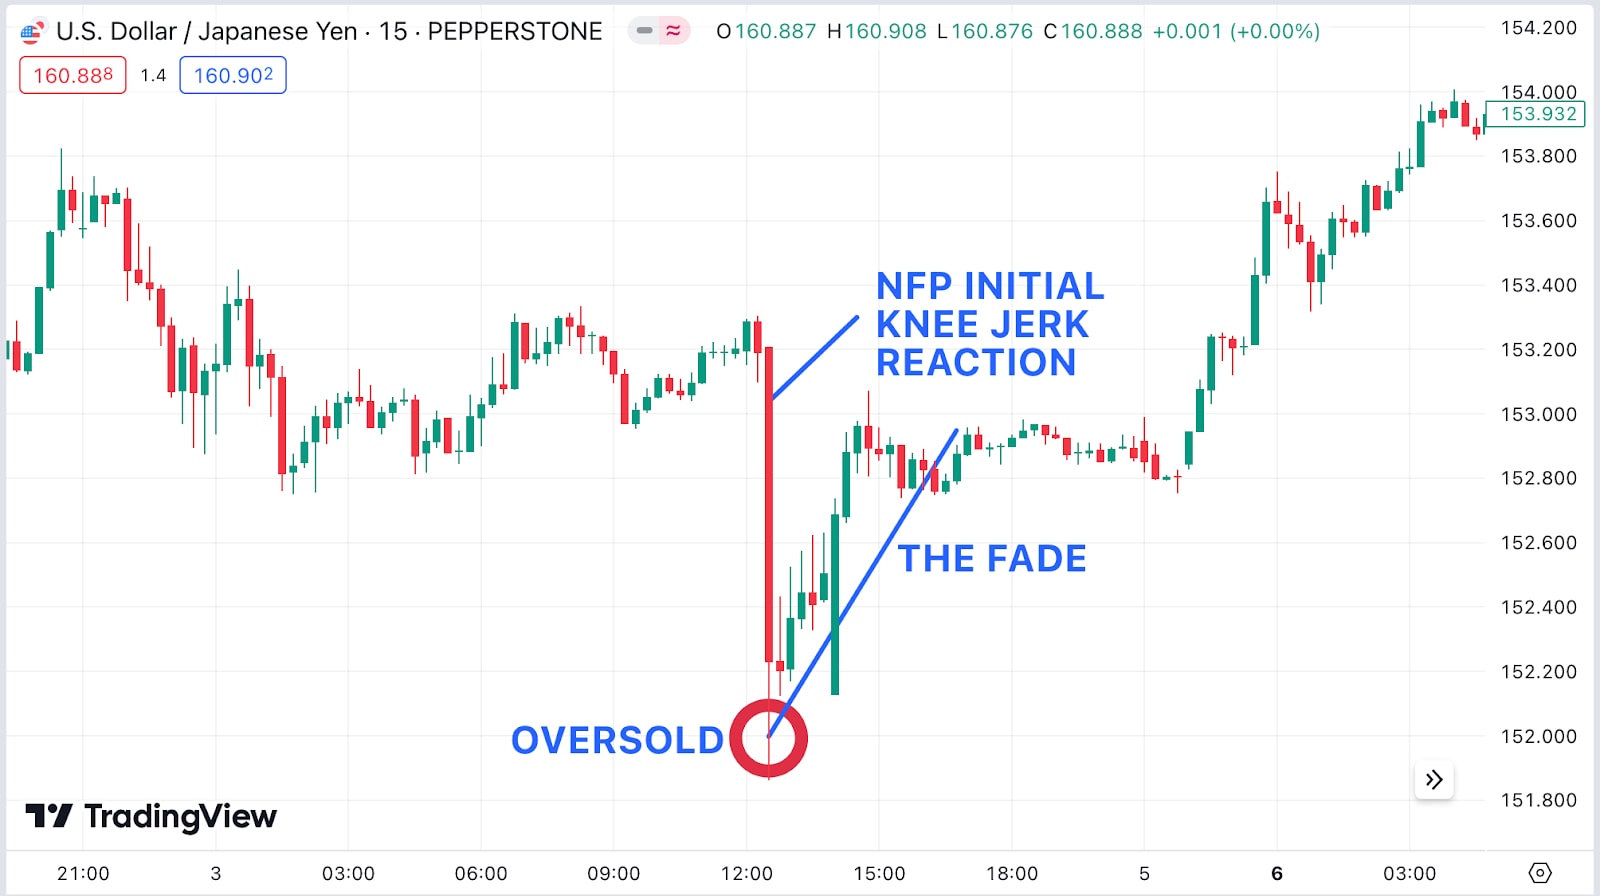
Don’t become accustomed to fading every NFP-induced spike. As a general rule, only look to fade spikes into key technical levels, like previous swing high/low, that should have been identified prior to the release.
Longer Term Positioning
- Swing - Longer term traders may use the NFP figures to set the tone for price direction over the rest of the month. Price action often aligns with the NFP data, indicating whether a currency pair’s trend for the month will be bullish or bearish. Most swing strategies will allow for at least a 10-15 minute wait before entering a trade.
Trade what is on the screen not on personal bias - either a trend continuation or short term reversal. “Trade what you see, not what you think.”
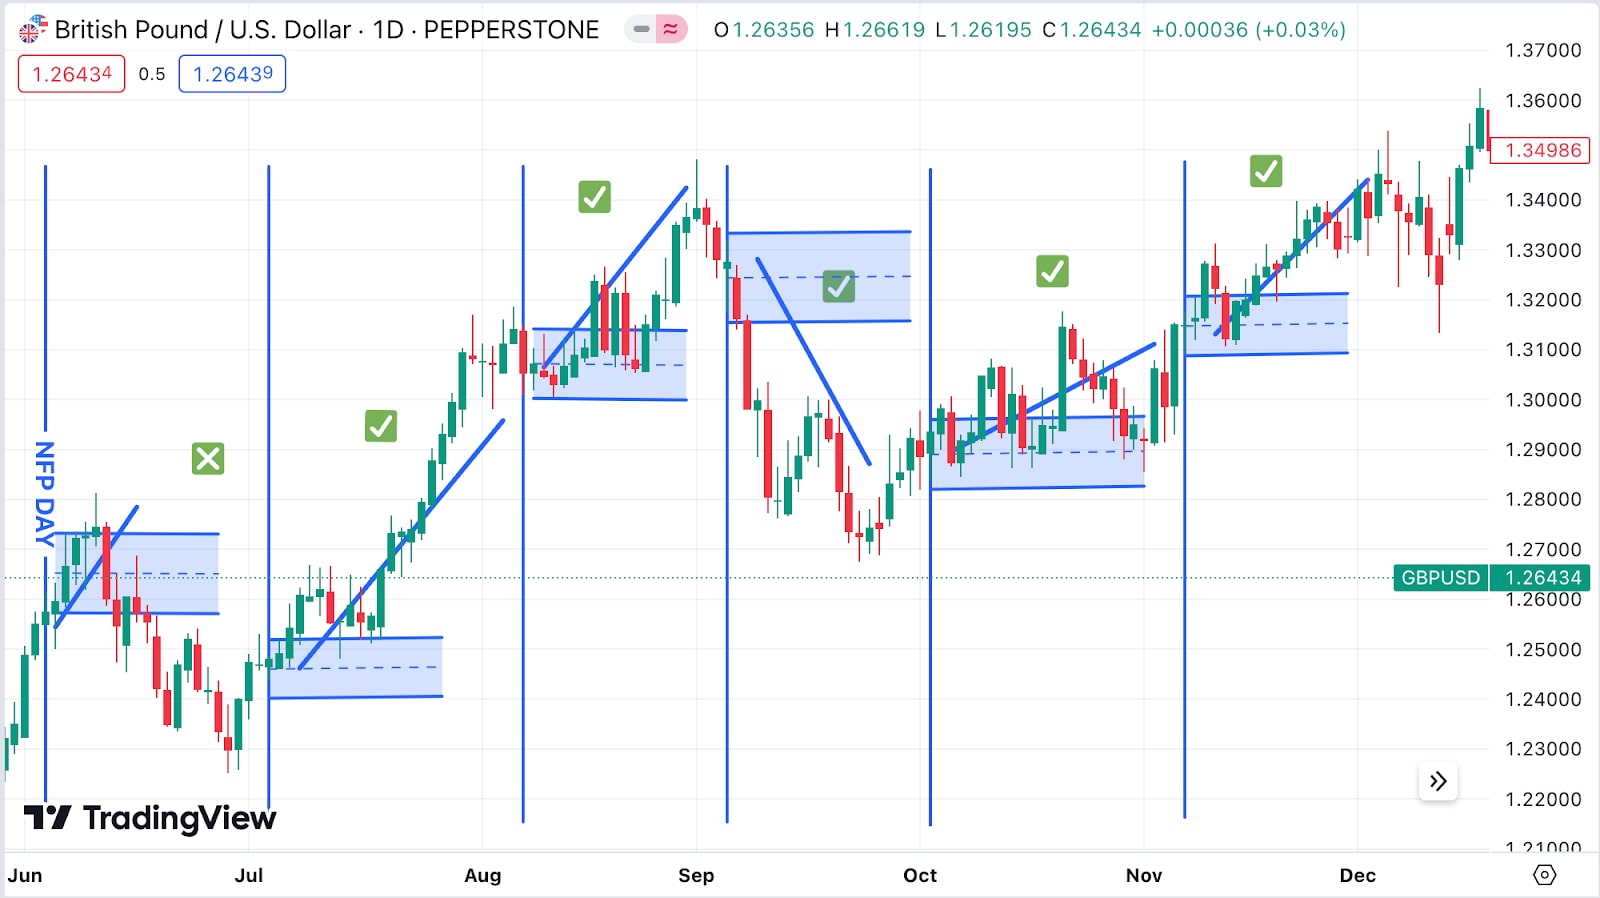
As is evident from the GBP/USD chart above, once Friday’s NFP high/low was broken in most cases the pair continued to trade in the direction of the breakout. A simple strategy would be to place a buy limit order above Friday’s high and a sell limit order below Friday’s low. The price should move at least 30 pips within 15 to 30 minutes of the NFP release. If the price only moves a few pips on the release, then it is clear the market doesn’t care so this strategy should not be used.
Consider using a demo account trading NFP until they become consistent in executing a number of pre-planned strategies.
What technical analysis tools should you consider?
Beyond fundamental strategies, technical patterns may signal entry points. There are hundreds of technical indicators from accumulation to zig zag but they can be grouped into five categories: trend, mean reversion, relative strength, volume, and momentum. You can use different indicators at the various stages of preparation through to exiting a trade.
Before release:
- Identify key support and resistance levels using moving averages and Fibonacci retracement. Set alerts at these levels.
After release:
- Wait for the initial market reaction to the NFP report. Use Bollinger Bands or pivot points to identify potential breakout levels.
- Confirmation: Confirm the direction with MACD crossovers or RSI levels. Look for volume confirmation to ensure the price movement is backed by strong trading activity.
- Entry and Exit: Enter trades based on breakouts from Bollinger Bands or pivot points, with confirmation from RSI and MACD. Set stop-loss orders just outside recent support/resistance levels to manage risk.
A more detailed guide to all the Trading Indicators mentioned above.
How can you use different time frames for analysis?
The length of time frames is dependent on the type of strategy adopted to trade. Consider a default chart and switch to two other time frames max only to confirm trends. In that context there are three time frames to analyse using a top down approach help you understand the broader market context, identify potential trading opportunities, and then execute trades:
Long-Term (Daily Chart)
- Trend Identification: Helps to determine the overall trend (up, down, or range-bound) by analysing price movement, moving averages, and other trend indicators.
- Key Levels: Identify significant support and resistance levels, trend lines, and long-term chart patterns.
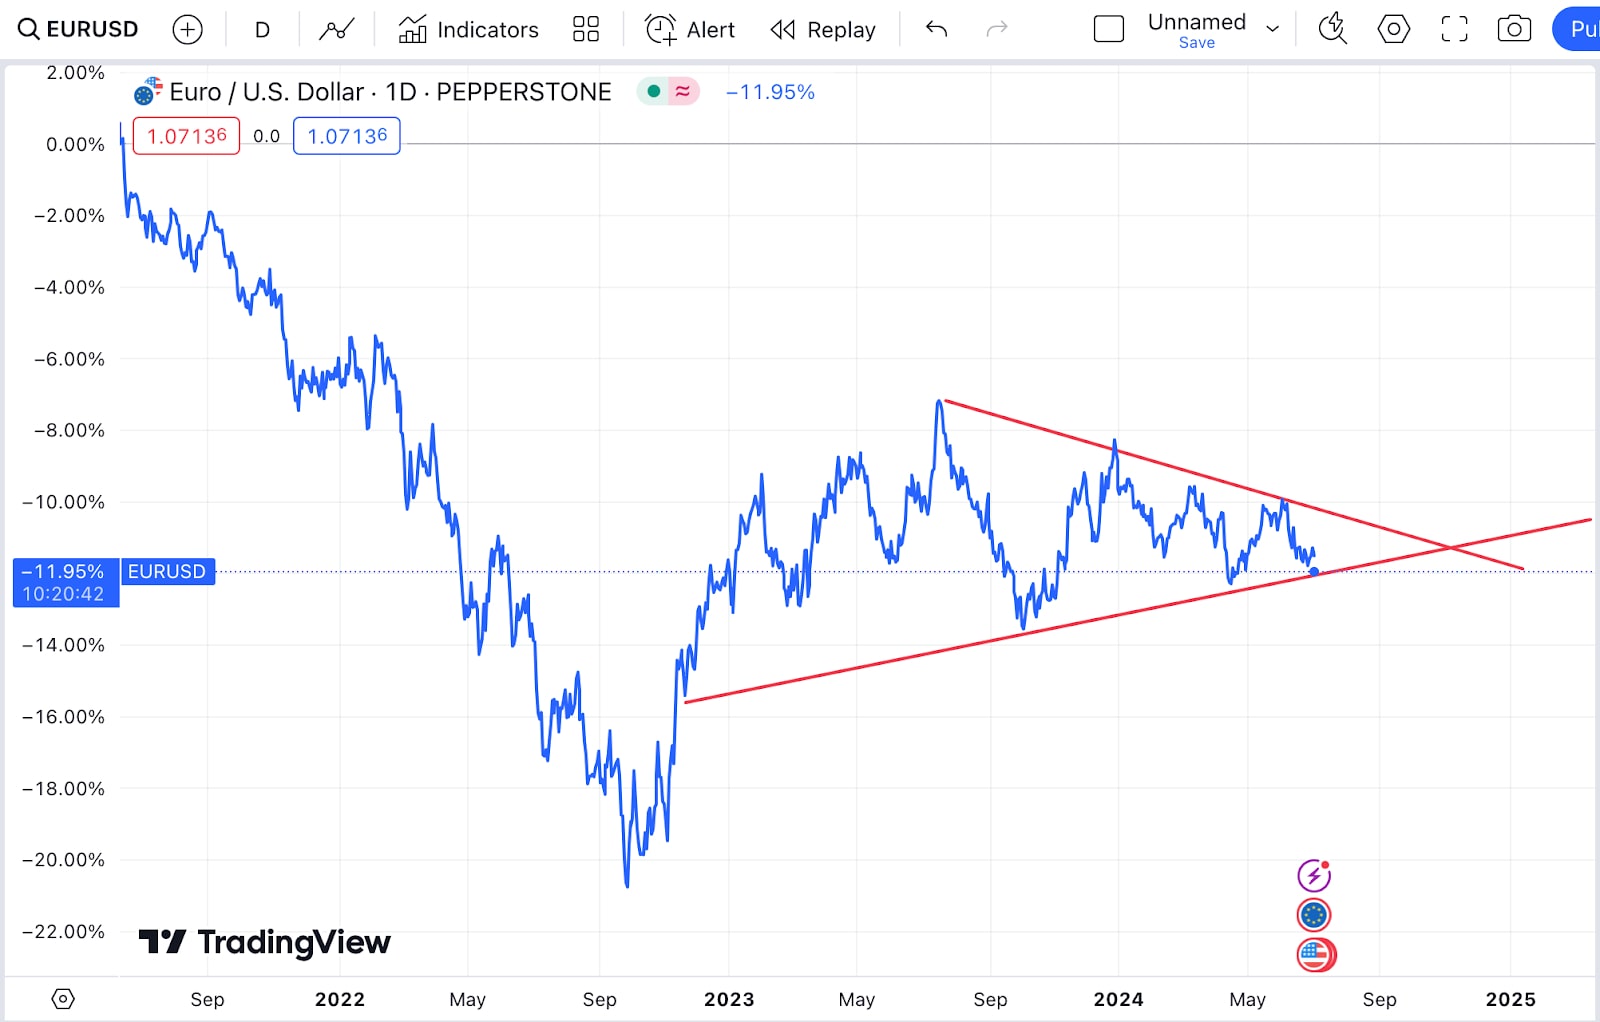
The EURUSD chart above shows the pair forming a near term bullish pennant pattern. Under such signals some traders may expect a break to the upside and look to enter long trades on a break above the pennant.
Medium-Term (4- and 1-Hour Charts)
- Intermediate Trend: Observe the intermediate trend within the context of the long-term trend. Identify consolidation patterns, continuation patterns, or reversal signals.
- Chart Patterns: Patterns like triangles, head and shoulders, flags, and pennants which might offer clues about the next move post-NFP.
Short-Term Analysis (15- and 5-Minute Charts)
- Immediate Reaction: These timeframes are crucial for capturing the immediate market reaction to the NFP report.
- Price Action Signals: Look for candlestick patterns, volume spikes, and other short-term indicators that can provide entry and exit signals.
Using narrower time frames, traders can improve entries and exits. Ultimately, the combination of multiple time frames allows for a better understanding of the trend.
How do you execute your trades during the NFP release?
The market post the NFP release moves fast most of the time so automate as much of the process as possible. If the market moves inline with expectations and the direction of trade, adjust stop-loss orders to lock in profits and reduce risk. Consider taking partial profits at key support/resistance levels to secure gains while leaving positions open to gain further from potential moves.
The material provided here has not been prepared in accordance with legal requirements designed to promote the independence of investment research and as such is considered to be a marketing communication. Whilst it is not subject to any prohibition on dealing ahead of the dissemination of investment research we will not seek to take any advantage before providing it to our clients.
Pepperstone doesn’t represent that the material provided here is accurate, current or complete, and therefore shouldn’t be relied upon as such. The information, whether from a third party or not, isn’t to be considered as a recommendation; or an offer to buy or sell; or the solicitation of an offer to buy or sell any security, financial product or instrument; or to participate in any particular trading strategy. It does not take into account readers’ financial situation or investment objectives. We advise any readers of this content to seek their own advice. Without the approval of Pepperstone, reproduction or redistribution of this information isn’t permitted.