Analysis
Trader thoughts - could rising equity volatility spill into other markets?

Notably the S&P 500 eyes its 50-day MA at 4424, with the same average at 4418 in S&P500 futures. A firm close below here would suggest the 19 August swing and then the 100-day MA may be challenged and with the VIX index now above 20%, rising equity vol could spill over into other asset classes.
The straddle breakeven move for Friday’s S&P 500 at-the-money options expiry is priced for a 1.6% move on the index (higher or lower) – so that offers insight into expected movement here. Friday’s options expiration (OPEX) should get some focus because the talk is market makers are long gamma, and this has had the effect of reducing volatility – when this gamma rolls off the market, it typically means the index is free to move as it should, as market makers have less position risk to hedge.
Almost like clockwork, over the past six months the S&P 500 has fallen in the week leading into OPEX, so the risk is we see this flow repeat and come into play this week, which could mean weakness into Friday’s expiry – although perhaps it's all too obvious now.
Recall, we’ve also now seen a run of five consecutive down days for the S&P 500 and Dow, and a run of six down days is something of a rarity. We see the spread between the VIX (S&P 500 30-day implied vol) rising sharply vs 20-day realised volatility widening sharply, which shows hedging flows have picked up. These hedging flows haven’t resulted in any genuine concern elsewhere though, with US crude eyeing a re-test of $70 and top of the recent range, while copper looks to have broken above horizontal resistance at $4.42p/lb.
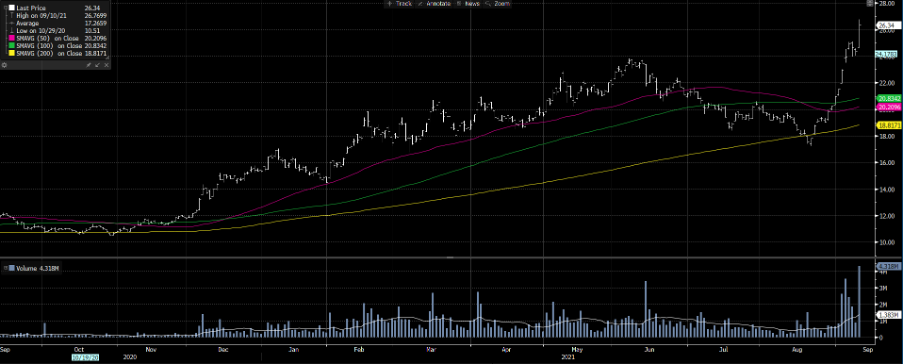
Seemingly the trade is to be long uranium, with raw uranium (‘yellowcake’) at the highest levels since 2014, and the URA ETF (Global X Uranium ETF) closing up 8.2% on Friday, taking the YTD gain to 71% - this is a hot play right now, helped by news the Sprott Physical Uranium Trust (Canadian asset manager) had purchased 6m pounds of physical uranium.

(Source: Bloomberg - Past performance is not indicative of future performance.)
In FX, the USD has found support although the buyers are not stating their case with two lower highs on the DXY daily. EURUSD finds supply into the 5-day EMA but really needs to break the 1.1800 level for shorts to really feel confident. On the docket this week ECB chief economist Lane speaks Thursday (01:00 AEST) and that could get things moving along, although it feels like the market is sensing we need to see a series of new intel before a big meeting in December. On the US side, the big event risk is US CPI (tomorrow at 22:30 AEST), with core and headline inflation eyed modestly lower at 4.2% and 5.3% respectively.
Eyes on the US bond market then, where yields on the 10-yr Treasury rose 4bp on Friday to 1.34% - a hot PPI print and constructive dialogue between President Biden and Xi looks have assisted. A n upside surprise in tomorrow’s US CPI print will add fuel to those calling for stagflation to progress, and a break of 1.37%/40% could see the USD turn higher. Gold may struggle in a rising USD environment and as we’ve seen on the daily it lacks a spark and range trading has been the tactical play – on the week, unless we see vol really pick up in the USD and Treasuries then fading strength into 1815 and buying weakness into 1760 seems the higher probability play.
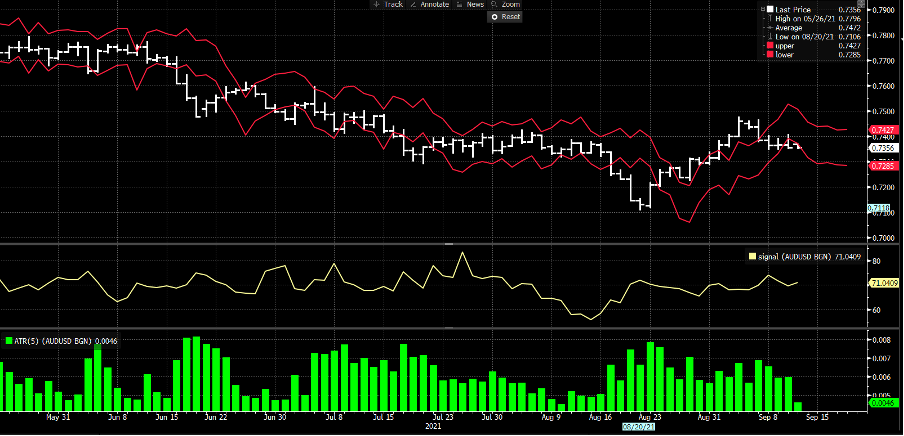
AUDUSD with implied volatility bands

(Source: Bloomberg - Past performance is not indicative of future performance.)
The may be some interest in China’s mid-week data dump (industrial production, retail sales and fixed asset investment), but unless its big beat/miss I’d not expect huge volatility. In Australia, we’re likely to see some interest in Thursday’s labour market data, which will be impacted by the lockdowns. The consensus is for 80k jobs to be lost in August, although its finger in the air predictions, with the distributions of outcomes ranging from -300k to -50k and a standard deviation of the average of 66k. AUDUSD weekly implied volatility sits at 8.45%, which is the 14th percentile of the 12-month range – so fireworks aren’t expected, and it puts a range (with a 68.2% level of confidence) of 0.7431 to 0.7272 in play this week – I’ve mapped this out using a rolling implied volatility band, which I’ve projected forward by 5 days – I’ve added a 5-Day ATR for risk management purposes.
Related articles
Ready to trade?
It's quick and easy to get started. Apply in minutes with our simple application process.
The material provided here has not been prepared in accordance with legal requirements designed to promote the independence of investment research and as such is considered to be a marketing communication. Whilst it is not subject to any prohibition on dealing ahead of the dissemination of investment research we will not seek to take any advantage before providing it to our clients.
Pepperstone doesn’t represent that the material provided here is accurate, current or complete, and therefore shouldn’t be relied upon as such. The information, whether from a third party or not, isn’t to be considered as a recommendation; or an offer to buy or sell; or the solicitation of an offer to buy or sell any security, financial product or instrument; or to participate in any particular trading strategy. It does not take into account readers’ financial situation or investment objectives. We advise any readers of this content to seek their own advice. Without the approval of Pepperstone, reproduction or redistribution of this information isn’t permitted.
